Beta-1,3-1,4-Glucanase
(All numbering and residues are taken from first PDB file)
![]()
![]()
Bending Residue Dihedral Analysis
Residue
iResidue
i+1Distance of hinge axis to residue i in
(A) Distance of hinge axis to residue i in
(A) Change in
(deg) Change in
(deg) Angle of psi(i) axis to hinge axis
(deg) Angle of psi(i) axis to hinge axis
(deg) Percentage Progress
GLU-78
HIS-79
6.0
6.0
-13.5
28.0
148.5
140.3
239.9
HIS-79
GLY-80
6.8
7.2
-22.9
20.3
104.5
103.4
17.9
GLY-80
LEU-81
5.6
5.6
-7.8
0.8
165.2
167.9
-145.0
LEU-81
ILE-82
4.7
4.9
1.9
-5.0
91.4
92.1
-30.5
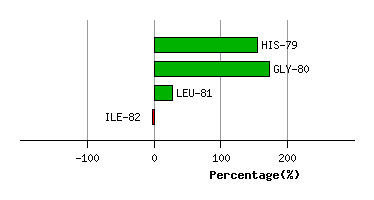
Graph shows rotational transition at bending residues and can be used
to identify hinge bending residues.
Probably only informative for interdomain rotations greater than 20 degrees
Residue
iResidue
i+1Distance of hinge axis to residue i in
(A) Distance of hinge axis to residue i in
(A) Change in
(deg) Change in
(deg) Angle of psi(i) axis to hinge axis
(deg) Angle of psi(i) axis to hinge axis
(deg) Percentage Progress
LEU-103
GLY-104
10.4
10.5
-0.8
2.5
32.1
31.9
-27.0
GLY-104
THR-105
10.4
10.7
8.8
-9.9
142.6
144.7
4.9
THR-105
GLY-106
11.1
11.4
-2.7
-12.3
82.8
81.3
81.4
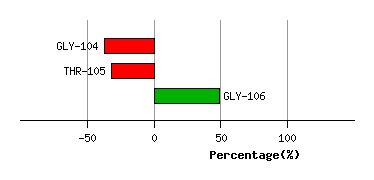
Graph shows rotational transition at bending residues and can be used
to identify hinge bending residues.
Probably only informative for interdomain rotations greater than 20 degrees
Residue
iResidue
i+1Distance of hinge axis to residue i in
(A) Distance of hinge axis to residue i in
(A) Change in
(deg) Change in
(deg) Angle of psi(i) axis to hinge axis
(deg) Angle of psi(i) axis to hinge axis
(deg) Percentage Progress
ILE-114
ASP-115
9.1
9.1
2.5
-2.9
121.6
119.8
69.7
ASP-115
ILE-116
9.2
9.4
1.8
-1.4
127.6
128.0
20.3
ILE-116
ILE-117
5.8
5.9
6.5
-8.4
146.5
148.1
-0.4
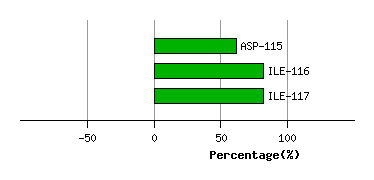
Graph shows rotational transition at bending residues and can be used
to identify hinge bending residues.
Probably only informative for interdomain rotations greater than 20 degrees
Residue
iResidue
i+1Distance of hinge axis to residue i in
(A) Distance of hinge axis to residue i in
(A) Change in
(deg) Change in
(deg) Angle of psi(i) axis to hinge axis
(deg) Angle of psi(i) axis to hinge axis
(deg) Percentage Progress
THR-124
PHE-125
10.7
10.7
1.6
-4.4
119.7
120.8
82.3
PHE-125
ASN-126
8.3
8.4
10.1
-9.8
166.6
168.4
12.0
ASN-126
HIS-127
7.8
7.8
0.0
-8.0
102.7
100.6
125.9
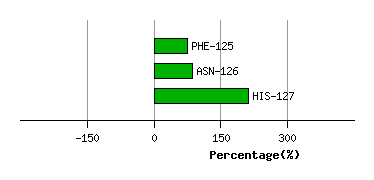
Graph shows rotational transition at bending residues and can be used
to identify hinge bending residues.
Probably only informative for interdomain rotations greater than 20 degrees
Residue
iResidue
i+1Distance of hinge axis to residue i in
(A) Distance of hinge axis to residue i in
(A) Change in
(deg) Change in
(deg) Angle of psi(i) axis to hinge axis
(deg) Angle of psi(i) axis to hinge axis
(deg) Percentage Progress
ASN-140
ASP-141
17.3
17.5
-42.4
30.7
64.3
65.7
198.6
ASP-141
GLY-142
16.0
16.2
6.3
4.0
51.6
51.1
146.1
GLY-142
PHE-143
13.9
14.2
8.2
-8.3
95.9
92.9
-25.6
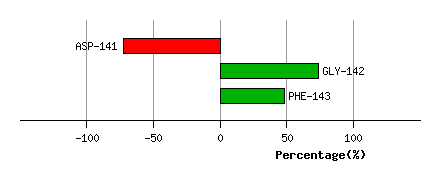
Graph shows rotational transition at bending residues and can be used
to identify hinge bending residues.
Probably only informative for interdomain rotations greater than 20 degrees
Residue
iResidue
i+1Distance of hinge axis to residue i in
(A) Distance of hinge axis to residue i in
(A) Change in
(deg) Change in
(deg) Angle of psi(i) axis to hinge axis
(deg) Angle of psi(i) axis to hinge axis
(deg) Percentage Progress
GLY-145
ASN-146
8.1
8.3
-7.7
13.9
105.7
109.2
-14.0
ASN-146
LEU-147
11.4
11.4
-11.9
-3.8
46.3
41.2
217.3
LEU-147
LYS-148
14.3
14.1
-3.4
7.2
109.1
106.2
-2.0
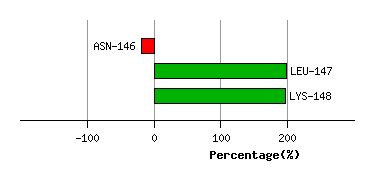
Graph shows rotational transition at bending residues and can be used
to identify hinge bending residues.
Probably only informative for interdomain rotations greater than 20 degrees
Residue
iResidue
i+1Distance of hinge axis to residue i in
(A) Distance of hinge axis to residue i in
(A) Change in
(deg) Change in
(deg) Angle of psi(i) axis to hinge axis
(deg) Angle of psi(i) axis to hinge axis
(deg) Percentage Progress
ILE-167
GLU-168
11.1
11.1
-0.8
5.4
66.3
65.9
-12.7
GLU-168
ALA-169
9.5
9.5
4.7
-2.9
115.6
111.4
-19.4
ALA-169
THR-170
5.9
5.8
0.5
-6.3
176.0
178.6
217.0
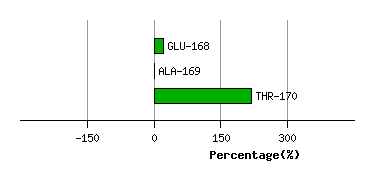
Graph shows rotational transition at bending residues and can be used
to identify hinge bending residues.
Probably only informative for interdomain rotations greater than 20 degrees
Residue
iResidue
i+1Distance of hinge axis to residue i in
(A) Distance of hinge axis to residue i in
(A) Change in
(deg) Change in
(deg) Angle of psi(i) axis to hinge axis
(deg) Angle of psi(i) axis to hinge axis
(deg) Percentage Progress
GLY-185
ILE-186
8.1
8.0
-1.3
0.1
20.5
22.0
8.7
ILE-186
TYR-187
6.2
6.0
3.6
-1.9
91.9
91.8
23.7
TYR-187
ALA-188
2.7
2.5
1.4
-5.3
147.5
147.9
92.9
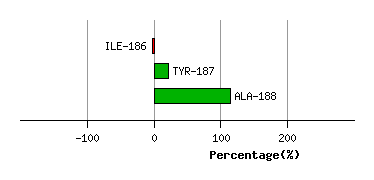
Graph shows rotational transition at bending residues and can be used
to identify hinge bending residues.
Probably only informative for interdomain rotations greater than 20 degrees
Residue
iResidue
i+1Distance of hinge axis to residue i in
(A) Distance of hinge axis to residue i in
(A) Change in
(deg) Change in
(deg) Angle of psi(i) axis to hinge axis
(deg) Angle of psi(i) axis to hinge axis
(deg) Percentage Progress
GLU-190
ILE-191
5.8
6.1
5.5
-1.4
67.1
69.3
7.6
ILE-191
THR-192
7.3
7.6
1.6
-3.2
56.9
58.3
-67.4
THR-192
PRO-193
10.7
11.0
-3.1
9.1
105.4
105.3
-19.7
PRO-193
ASN-194
13.7
14.0
6.9
-25.3
141.5
139.7
363.8
ASN-194
GLY-195
15.4
15.6
28.5
-13.2
136.4
140.3
-260.9
GLY-195
ILE-196
12.8
13.0
-1.1
-6.9
85.2
87.6
45.7
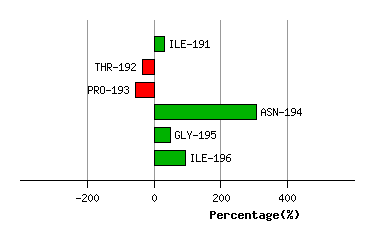
Graph shows rotational transition at bending residues and can be used
to identify hinge bending residues.
Probably only informative for interdomain rotations greater than 20 degrees
Residue
iResidue
i+1Distance of hinge axis to residue i in
(A) Distance of hinge axis to residue i in
(A) Change in
(deg) Change in
(deg) Angle of psi(i) axis to hinge axis
(deg) Angle of psi(i) axis to hinge axis
(deg) Percentage Progress
PRO-223
ALA-224
7.3
7.5
5.4
2.8
50.8
51.6
108.9
ALA-224
ALA-225
5.5
5.6
-3.4
-0.2
70.1
70.6
30.2
ALA-225
LYS-226
7.8
7.9
-2.6
2.2
44.4
42.3
30.0
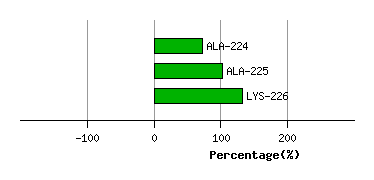
Graph shows rotational transition at bending residues and can be used
to identify hinge bending residues.
Probably only informative for interdomain rotations greater than 20 degrees
Residue
iResidue
i+1Distance of hinge axis to residue i in
(A) Distance of hinge axis to residue i in
(A) Change in
(deg) Change in
(deg) Angle of psi(i) axis to hinge axis
(deg) Angle of psi(i) axis to hinge axis
(deg) Percentage Progress
ASP-233
TRP-234
19.3
19.4
-5.3
1.5
93.9
92.7
5.1
TRP-234
GLU-235
15.6
15.7
-0.9
4.8
151.4
152.2
91.4
GLU-235
GLY-236
14.7
15.0
7.4
-8.5
58.6
59.0
-21.4
GLY-236
LYS-237
16.4
16.6
0.9
1.1
64.7
65.7
58.4
GLY-236
LYS-237
16.4
16.6
0.9
1.1
64.7
65.7
58.4
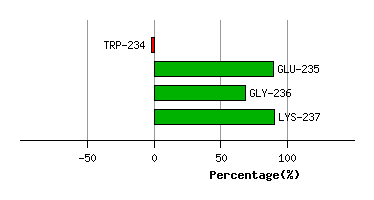
Graph shows rotational transition at bending residues and can be used
to identify hinge bending residues.
Probably only informative for interdomain rotations greater than 20 degrees
Residue
iResidue
i+1Distance of hinge axis to residue i in
(A) Distance of hinge axis to residue i in
(A) Change in
(deg) Change in
(deg) Angle of psi(i) axis to hinge axis
(deg) Angle of psi(i) axis to hinge axis
(deg) Percentage Progress
GLY-236
LYS-237
16.4
16.6
0.9
1.1
64.7
65.7
58.4
GLY-236
LYS-237
16.4
16.6
0.9
1.1
64.7
65.7
58.4
LYS-237
PHE-238
16.0
15.9
-7.8
8.9
87.2
83.8
11.0
PHE-238
ASN-239
12.2
12.2
17.9
-15.9
147.7
151.2
-32.8
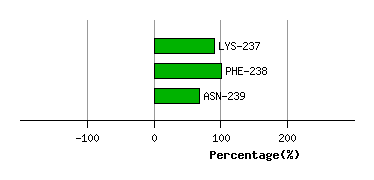
Graph shows rotational transition at bending residues and can be used
to identify hinge bending residues.
Probably only informative for interdomain rotations greater than 20 degrees
Residue
iResidue
i+1Distance of hinge axis to residue i in
(A) Distance of hinge axis to residue i in
(A) Change in
(deg) Change in
(deg) Angle of psi(i) axis to hinge axis
(deg) Angle of psi(i) axis to hinge axis
(deg) Percentage Progress
ALA-240
GLN-241
6.9
6.8
1.0
-1.3
130.0
127.2
-12.8
GLN-241
ARG-242
6.3
6.3
4.7
0.5
82.6
82.4
-0.7
ARG-242
LEU-243
6.6
6.8
-0.1
-6.5
22.4
19.2
100.8
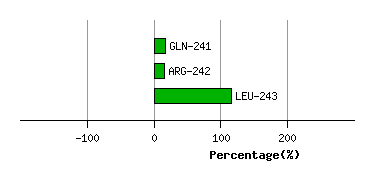
Graph shows rotational transition at bending residues and can be used
to identify hinge bending residues.
Probably only informative for interdomain rotations greater than 20 degrees