Aspartate Aminotransferase
(All numbering and residues are taken from first PDB file)
![]()
![]()
Bending Residue Dihedral Analysis
Residue
iResidue
i+1Distance of hinge axis to residue i in
(A) Distance of hinge axis to residue i in
(A) Change in
(deg) Change in
(deg) Angle of psi(i) axis to hinge axis
(deg) Angle of psi(i) axis to hinge axis
(deg) Percentage Progress
ILE-33
ASN-34
14.0
13.5
22.3
-12.8
61.8
66.3
71.4
ASN-34
LEU-35
12.1
12.0
-3.9
9.9
107.8
110.9
43.6
LEU-35
GLY-36
9.1
9.1
-6.1
-14.6
124.3
115.7
-73.0
GLY-36
ILE-37
10.3
10.4
90.5
-16.4
109.0
133.3
-234.9
ILE-37
GLY-38
10.5
9.3
-14.0
-18.9
67.6
100.6
-39.0
GLY-38
LEU-39
7.7
8.9
-69.3
-12.9
14.9
40.4
499.5
LEU-39
TYR-40
7.2
7.5
13.7
23.2
103.4
104.2
-74.6
TYR-40
TYR-41
3.8
4.1
29.1
-36.3
135.4
133.3
-51.9
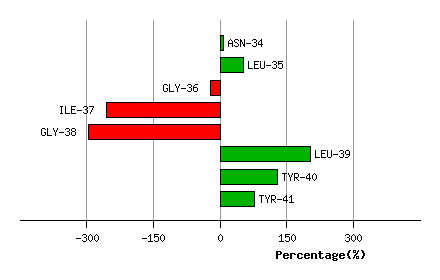
Graph shows rotational transition at bending residues and can be used
to identify hinge bending residues.
Probably only informative for interdomain rotations greater than 20 degrees
Residue
iResidue
i+1Distance of hinge axis to residue i in
(A) Distance of hinge axis to residue i in
(A) Change in
(deg) Change in
(deg) Angle of psi(i) axis to hinge axis
(deg) Angle of psi(i) axis to hinge axis
(deg) Percentage Progress
GLN-331
ARG-332
7.5
7.7
-6.1
16.3
95.0
97.5
18.7
ARG-332
MET-333
9.2
9.4
-10.3
5.0
69.1
63.7
5.4
MET-333
ARG-334
7.5
7.9
-9.4
-7.0
3.7
6.8
83.5
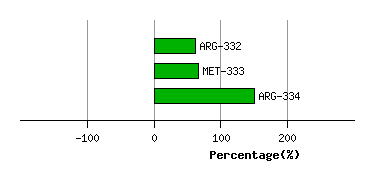
Graph shows rotational transition at bending residues and can be used
to identify hinge bending residues.
Probably only informative for interdomain rotations greater than 20 degrees
Residue
iResidue
i+1Distance of hinge axis to residue i in
(A) Distance of hinge axis to residue i in
(A) Change in
(deg) Change in
(deg) Angle of psi(i) axis to hinge axis
(deg) Angle of psi(i) axis to hinge axis
(deg) Percentage Progress
ARG-348
ASP-349
13.7
14.6
0.4
9.3
130.5
117.9
-22.7
ASP-349
PHE-350
12.9
12.7
-11.9
1.1
68.2
51.4
73.2
PHE-350
SER-351
10.1
10.7
5.2
-1.1
115.4
113.3
-32.6
SER-351
PHE-352
11.0
10.6
-11.8
8.5
93.3
76.8
4.6
PHE-352
ILE-353
8.1
6.9
-14.2
6.6
35.8
17.9
42.0
ILE-353
ILE-354
6.4
6.6
-20.7
-10.5
44.5
50.4
149.3
ILE-354
LYS-355
8.7
8.9
-1.9
18.9
100.2
108.0
-12.9
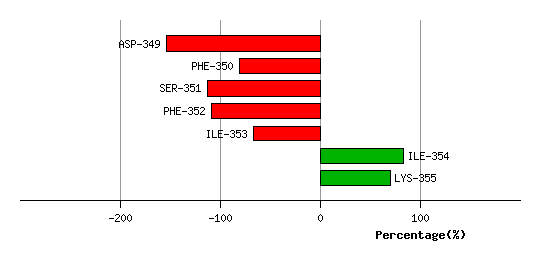
Graph shows rotational transition at bending residues and can be used
to identify hinge bending residues.
Probably only informative for interdomain rotations greater than 20 degrees
Residue
iResidue
i+1Distance of hinge axis to residue i in
(A) Distance of hinge axis to residue i in
(A) Change in
(deg) Change in
(deg) Angle of psi(i) axis to hinge axis
(deg) Angle of psi(i) axis to hinge axis
(deg) Percentage Progress
MET-359
PHE-360
2.2
2.4
-4.2
14.4
46.9
40.3
18.4
PHE-360
SER-361
1.7
2.5
-9.9
-20.7
39.8
48.7
95.4
SER-361
PHE-362
1.3
1.0
-11.4
-3.3
45.9
40.3
75.6
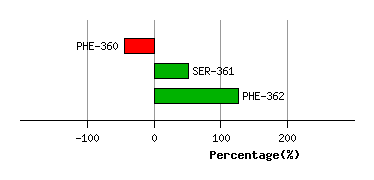
Graph shows rotational transition at bending residues and can be used
to identify hinge bending residues.
Probably only informative for interdomain rotations greater than 20 degrees
Residue
iResidue
i+1Distance of hinge axis to residue i in
(A) Distance of hinge axis to residue i in
(A) Change in
(deg) Change in
(deg) Angle of psi(i) axis to hinge axis
(deg) Angle of psi(i) axis to hinge axis
(deg) Percentage Progress
GLY-385
ARG-386
8.2
8.0
0.7
-3.1
135.2
134.3
55.0
ARG-386
VAL-387
6.2
6.2
11.0
-14.9
151.4
153.2
8.2
VAL-387
ASN-388
6.0
5.9
-3.0
0.0
48.2
50.0
69.3
ASN-388
VAL-389
4.6
4.7
18.8
-7.5
119.1
119.6
-23.2
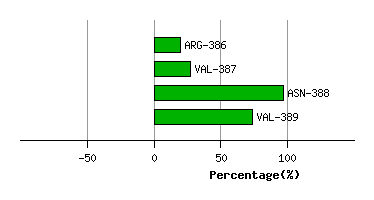
Graph shows rotational transition at bending residues and can be used
to identify hinge bending residues.
Probably only informative for interdomain rotations greater than 20 degrees