Anthranilate Phosphoribosyltransferase
(All numbering and residues are taken from first PDB file)
![]()
![]()
Bending Residue Dihedral Analysis
Residue
iResidue
i+1Distance of hinge axis to residue i in
(A) Distance of hinge axis to residue i in
(A) Change in
(deg) Change in
(deg) Angle of psi(i) axis to hinge axis
(deg) Angle of psi(i) axis to hinge axis
(deg) Percentage Progress
ASP-75
ALA-76
3.3
3.2
19.4
-3.7
76.1
72.1
32.1
ALA-76
GLN-77
0.9
1.2
-3.4
0.3
79.2
76.2
-13.9
GLN-77
PRO-78
4.4
4.6
0.0
6.9
37.7
40.4
69.2
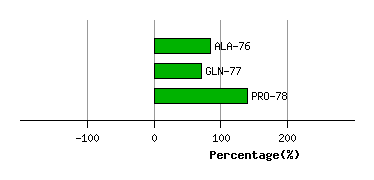
Graph shows rotational transition at bending residues and can be used
to identify hinge bending residues.
Probably only informative for interdomain rotations greater than 20 degrees
Residue
iResidue
i+1Distance of hinge axis to residue i in
(A) Distance of hinge axis to residue i in
(A) Change in
(deg) Change in
(deg) Angle of psi(i) axis to hinge axis
(deg) Angle of psi(i) axis to hinge axis
(deg) Percentage Progress
LEU-162
PHE-163
8.5
8.4
-2.4
-3.8
109.7
110.5
-25.2
PHE-163
ALA-164
9.6
9.5
3.1
1.7
53.4
51.5
51.1
ALA-164
PRO-165
7.3
7.2
1.0
1.7
5.6
7.8
32.5
PRO-165
GLN-166
8.8
8.9
-3.9
-2.3
117.3
115.2
-38.5
GLN-166
TYR-167
8.4
8.3
-7.6
5.5
97.4
94.7
-23.4
TYR-167
HIS-168
4.8
4.8
15.9
-18.3
65.6
67.6
-3.5
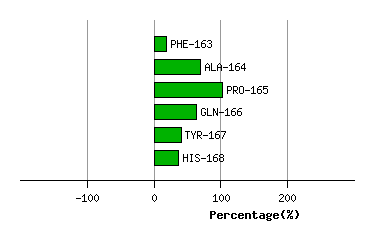
Graph shows rotational transition at bending residues and can be used
to identify hinge bending residues.
Probably only informative for interdomain rotations greater than 20 degrees
Residue
iResidue
i+1Distance of hinge axis to residue i in
(A) Distance of hinge axis to residue i in
(A) Change in
(deg) Change in
(deg) Angle of psi(i) axis to hinge axis
(deg) Angle of psi(i) axis to hinge axis
(deg) Percentage Progress
ARG-198
PRO-199
4.9
4.7
-0.1
1.9
158.3
152.9
24.0
PRO-199
PRO-200
4.9
5.1
8.1
0.6
62.1
60.3
60.2
PRO-200
LYS-201
7.1
7.1
-4.4
5.9
139.8
137.2
21.0
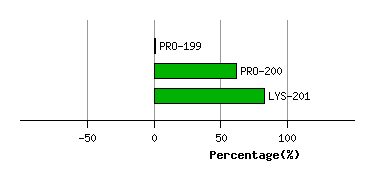
Graph shows rotational transition at bending residues and can be used
to identify hinge bending residues.
Probably only informative for interdomain rotations greater than 20 degrees