T4 Lysozyme
(All numbering and residues are taken from first PDB file)
![]()
![]()
Bending Residue Dihedral Analysis
Residue
iResidue
i+1Distance of hinge axis to residue i in
(A) Distance of hinge axis to residue i in
(A) Change in
(deg) Change in
(deg) Angle of psi(i) axis to hinge axis
(deg) Angle of psi(i) axis to hinge axis
(deg) Percentage Progress
ARG-8
ILE-9
3.9
2.9
1.0
8.6
141.0
144.0
-13.5
ILE-9
ASP-10
5.4
4.9
-3.9
7.9
91.5
87.2
0.6
ASP-10
GLU-11
5.6
5.4
1.1
11.0
93.4
102.8
-12.5
GLU-11
GLY-12
3.0
3.2
11.7
-28.4
129.4
140.6
35.3
GLY-12
LEU-13
0.2
0.9
50.9
-36.5
62.6
68.4
39.4
LEU-13
ARG-14
3.9
3.9
-14.1
-2.6
50.5
46.7
19.8
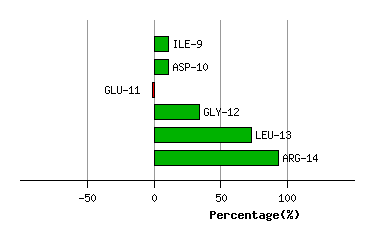
Graph shows rotational transition at bending residues and can be used
to identify hinge bending residues.
Probably only informative for interdomain rotations greater than 20 degrees
Residue
iResidue
i+1Distance of hinge axis to residue i in
(A) Distance of hinge axis to residue i in
(A) Change in
(deg) Change in
(deg) Angle of psi(i) axis to hinge axis
(deg) Angle of psi(i) axis to hinge axis
(deg) Percentage Progress
ASP-70
VAL-71
3.9
4.4
10.6
-6.2
113.2
106.6
12.1
VAL-71
ASP-72
1.8
1.3
-0.8
4.0
2.6
4.2
-21.4
ASP-72
ALA-73
2.9
2.7
-4.3
-1.0
65.5
61.8
21.3
ALA-73
ALA-74
3.0
3.6
0.8
2.5
85.2
90.1
1.0
ALA-74
VAL-75
2.5
3.2
-4.5
7.3
41.9
44.1
7.5
VAL-75
ARG-76
2.5
2.2
-8.3
-8.6
22.9
23.5
43.7
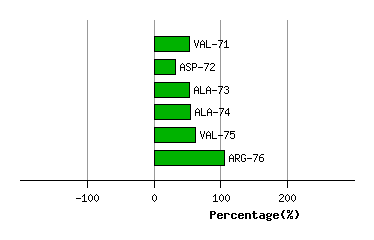
Graph shows rotational transition at bending residues and can be used
to identify hinge bending residues.
Probably only informative for interdomain rotations greater than 20 degrees