Beta-Actin
(All numbering and residues are taken from first PDB file)
![]()
![]()
Bending Residue Dihedral Analysis
Residue
iResidue
i+1Distance of hinge axis to residue i in
(A) Distance of hinge axis to residue i in
(A) Change in
(deg) Change in
(deg) Angle of psi(i) axis to hinge axis
(deg) Angle of psi(i) axis to hinge axis
(deg) Percentage Progress
THR-106
GLU-107
4.5
4.0
8.5
5.2
50.6
50.5
45.8
GLU-107
ALA-108
1.5
0.9
-13.9
10.2
66.4
65.1
19.3
ALA-108
PRO-109
2.7
3.0
14.6
9.7
74.2
77.1
100.8
PRO-109
LEU-110
6.2
6.4
20.1
-24.9
147.9
157.6
48.1
PRO-109
LEU-110
6.2
6.4
20.1
-24.9
147.9
157.6
48.1
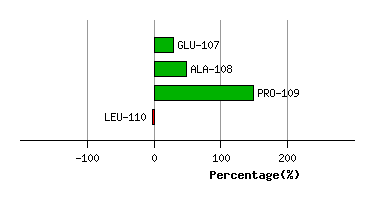
Graph shows rotational transition at bending residues and can be used
to identify hinge bending residues.
Probably only informative for interdomain rotations greater than 20 degrees
Residue
iResidue
i+1Distance of hinge axis to residue i in
(A) Distance of hinge axis to residue i in
(A) Change in
(deg) Change in
(deg) Angle of psi(i) axis to hinge axis
(deg) Angle of psi(i) axis to hinge axis
(deg) Percentage Progress
PRO-109
LEU-110
6.2
6.4
20.1
-24.9
147.9
157.6
48.1
PRO-109
LEU-110
6.2
6.4
20.1
-24.9
147.9
157.6
48.1
LEU-110
ASN-111
7.5
8.0
2.2
-19.9
127.4
130.8
116.4
ASN-111
PRO-112
4.1
4.6
-8.4
10.6
23.6
32.7
-39.3
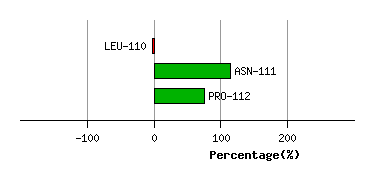
Graph shows rotational transition at bending residues and can be used
to identify hinge bending residues.
Probably only informative for interdomain rotations greater than 20 degrees
Residue
iResidue
i+1Distance of hinge axis to residue i in
(A) Distance of hinge axis to residue i in
(A) Change in
(deg) Change in
(deg) Angle of psi(i) axis to hinge axis
(deg) Angle of psi(i) axis to hinge axis
(deg) Percentage Progress
ILE-136
GLN-137
4.8
4.7
-8.6
2.7
25.3
23.0
7.8
GLN-137
ALA-138
2.2
2.1
-14.1
10.2
38.6
46.8
19.4
ALA-138
VAL-139
4.8
4.8
-5.3
-3.1
69.6
69.0
34.8
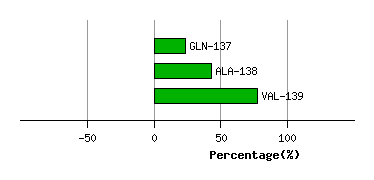
Graph shows rotational transition at bending residues and can be used
to identify hinge bending residues.
Probably only informative for interdomain rotations greater than 20 degrees
Residue
iResidue
i+1Distance of hinge axis to residue i in
(A) Distance of hinge axis to residue i in
(A) Change in
(deg) Change in
(deg) Angle of psi(i) axis to hinge axis
(deg) Angle of psi(i) axis to hinge axis
(deg) Percentage Progress
GLU-334
ARG-335
2.7
3.0
-17.6
-8.4
24.1
29.5
138.6
ARG-335
LYS-336
2.2
1.9
-27.3
26.2
46.1
47.6
29.0
LYS-336
TYR-337
5.0
5.2
5.2
-18.4
125.3
132.9
44.5
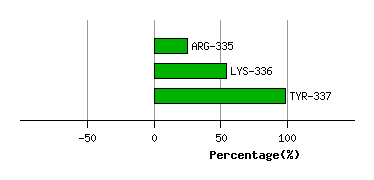
Graph shows rotational transition at bending residues and can be used
to identify hinge bending residues.
Probably only informative for interdomain rotations greater than 20 degrees