Beta-1,3-1,4-Glucanase
(All numbering and residues are taken from first PDB file)
![]()
![]()
Bending Residue Dihedral Analysis
Residue
iResidue
i+1Distance of hinge axis to residue i in
(A) Distance of hinge axis to residue i in
(A) Change in
(deg) Change in
(deg) Angle of psi(i) axis to hinge axis
(deg) Angle of psi(i) axis to hinge axis
(deg) Percentage Progress
GLU-78
HIS-79
2.4
2.3
-10.2
30.4
150.2
139.7
423.7
HIS-79
GLY-80
2.7
3.2
-22.2
14.7
104.7
103.6
-2.6
GLY-80
LEU-81
3.1
3.2
-2.3
-4.0
166.3
168.4
-172.6
LEU-81
ILE-82
4.3
4.3
0.1
-2.0
91.0
91.5
-2.8
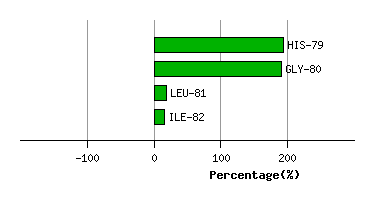
Graph shows rotational transition at bending residues and can be used
to identify hinge bending residues.
Probably only informative for interdomain rotations greater than 20 degrees
Residue
iResidue
i+1Distance of hinge axis to residue i in
(A) Distance of hinge axis to residue i in
(A) Change in
(deg) Change in
(deg) Angle of psi(i) axis to hinge axis
(deg) Angle of psi(i) axis to hinge axis
(deg) Percentage Progress
GLY-111
GLY-112
12.4
12.1
8.4
4.7
27.0
26.6
312.8
GLY-112
ALA-113
12.0
11.7
2.3
-1.6
73.2
71.5
43.7
ALA-113
ILE-114
11.0
11.0
-9.9
2.6
148.7
146.9
-225.2
ILE-114
ASP-115
8.5
8.4
-2.5
-3.6
122.5
120.4
-17.0
ASP-115
ILE-116
9.6
9.7
1.7
-1.4
56.5
52.4
-73.6
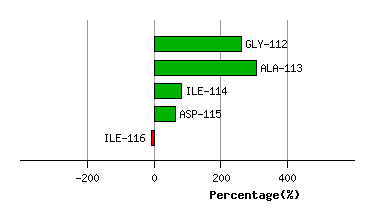
Graph shows rotational transition at bending residues and can be used
to identify hinge bending residues.
Probably only informative for interdomain rotations greater than 20 degrees
Residue
iResidue
i+1Distance of hinge axis to residue i in
(A) Distance of hinge axis to residue i in
(A) Change in
(deg) Change in
(deg) Angle of psi(i) axis to hinge axis
(deg) Angle of psi(i) axis to hinge axis
(deg) Percentage Progress
THR-124
PHE-125
12.7
12.8
2.5
-5.7
121.4
121.5
105.8
PHE-125
ASN-126
9.7
9.8
4.9
-9.4
168.1
168.2
138.1
ASN-126
HIS-127
9.0
9.2
-5.0
0.7
79.2
79.0
187.4
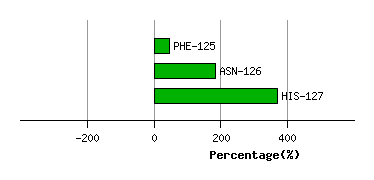
Graph shows rotational transition at bending residues and can be used
to identify hinge bending residues.
Probably only informative for interdomain rotations greater than 20 degrees
Residue
iResidue
i+1Distance of hinge axis to residue i in
(A) Distance of hinge axis to residue i in
(A) Change in
(deg) Change in
(deg) Angle of psi(i) axis to hinge axis
(deg) Angle of psi(i) axis to hinge axis
(deg) Percentage Progress
ASP-134
GLY-135
20.9
20.8
-5.8
7.8
97.2
97.6
4.4
GLY-135
CYS-136
20.4
20.2
0.8
-1.5
107.7
110.5
-1.1
CYS-136
THR-137
17.2
17.1
-3.5
2.5
8.5
7.0
77.7
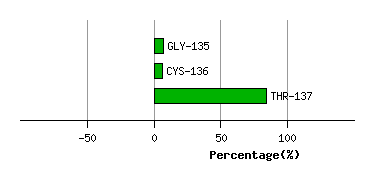
Graph shows rotational transition at bending residues and can be used
to identify hinge bending residues.
Probably only informative for interdomain rotations greater than 20 degrees
Residue
iResidue
i+1Distance of hinge axis to residue i in
(A) Distance of hinge axis to residue i in
(A) Change in
(deg) Change in
(deg) Angle of psi(i) axis to hinge axis
(deg) Angle of psi(i) axis to hinge axis
(deg) Percentage Progress
GLY-145
ASN-146
4.9
5.1
0.0
2.6
75.1
70.9
-71.4
ASN-146
LEU-147
8.4
8.6
-9.1
-0.6
44.3
41.4
231.8
LEU-147
LYS-148
11.2
11.3
-14.7
9.7
109.1
106.6
-64.3
LYS-148
THR-149
13.8
13.9
0.2
-1.6
121.9
124.7
-7.4
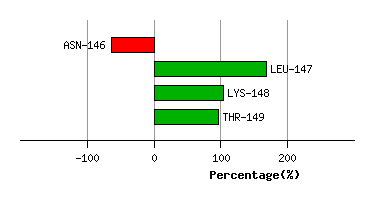
Graph shows rotational transition at bending residues and can be used
to identify hinge bending residues.
Probably only informative for interdomain rotations greater than 20 degrees
Residue
iResidue
i+1Distance of hinge axis to residue i in
(A) Distance of hinge axis to residue i in
(A) Change in
(deg) Change in
(deg) Angle of psi(i) axis to hinge axis
(deg) Angle of psi(i) axis to hinge axis
(deg) Percentage Progress
CYS-165
GLY-166
13.9
13.9
8.1
-9.4
113.8
112.6
-9.6
GLY-166
ILE-167
11.8
11.8
-3.6
2.5
39.0
37.5
82.9
ILE-167
GLU-168
9.0
9.0
3.5
-2.5
114.6
114.7
47.3
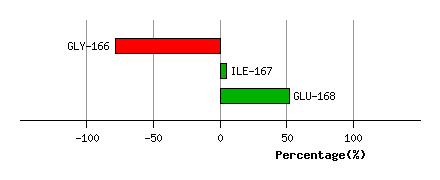
Graph shows rotational transition at bending residues and can be used
to identify hinge bending residues.
Probably only informative for interdomain rotations greater than 20 degrees
Residue
iResidue
i+1Distance of hinge axis to residue i in
(A) Distance of hinge axis to residue i in
(A) Change in
(deg) Change in
(deg) Angle of psi(i) axis to hinge axis
(deg) Angle of psi(i) axis to hinge axis
(deg) Percentage Progress
GLY-185
ILE-186
11.8
11.7
0.2
0.2
159.2
158.4
-13.8
ILE-186
TYR-187
9.7
9.5
2.1
-1.5
93.6
92.1
-7.8
TYR-187
ALA-188
6.5
6.3
2.3
-9.4
148.3
148.6
210.3
ALA-188
THR-189
4.8
4.7
-0.6
-0.6
77.8
79.3
170.2
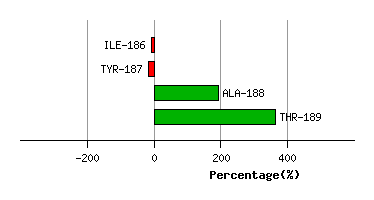
Graph shows rotational transition at bending residues and can be used
to identify hinge bending residues.
Probably only informative for interdomain rotations greater than 20 degrees
Residue
iResidue
i+1Distance of hinge axis to residue i in
(A) Distance of hinge axis to residue i in
(A) Change in
(deg) Change in
(deg) Angle of psi(i) axis to hinge axis
(deg) Angle of psi(i) axis to hinge axis
(deg) Percentage Progress
GLU-190
ILE-191
2.4
2.6
2.8
1.2
69.0
69.2
42.1
ILE-191
THR-192
3.3
3.5
-2.2
1.2
124.1
122.4
-48.7
THR-192
PRO-193
6.7
6.9
-2.2
8.0
105.5
105.5
9.0
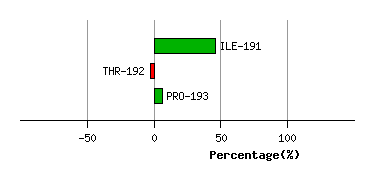
Graph shows rotational transition at bending residues and can be used
to identify hinge bending residues.
Probably only informative for interdomain rotations greater than 20 degrees
Residue
iResidue
i+1Distance of hinge axis to residue i in
(A) Distance of hinge axis to residue i in
(A) Change in
(deg) Change in
(deg) Angle of psi(i) axis to hinge axis
(deg) Angle of psi(i) axis to hinge axis
(deg) Percentage Progress
ALA-225
LYS-226
4.3
4.4
-0.7
0.9
41.0
41.6
23.9
LYS-226
PHE-227
6.6
6.7
-0.9
0.8
74.4
73.1
-11.0
PHE-227
ALA-228
9.1
9.2
-0.6
-3.4
51.3
52.0
141.7
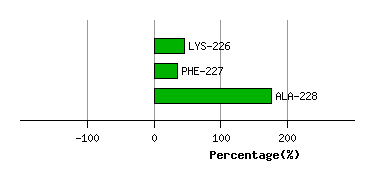
Graph shows rotational transition at bending residues and can be used
to identify hinge bending residues.
Probably only informative for interdomain rotations greater than 20 degrees
Residue
iResidue
i+1Distance of hinge axis to residue i in
(A) Distance of hinge axis to residue i in
(A) Change in
(deg) Change in
(deg) Angle of psi(i) axis to hinge axis
(deg) Angle of psi(i) axis to hinge axis
(deg) Percentage Progress
ASP-233
TRP-234
15.6
15.7
-1.9
-2.0
93.0
92.3
-10.1
TRP-234
GLU-235
11.9
12.0
-1.6
7.9
151.3
151.8
198.6
GLU-235
GLY-236
11.0
11.1
0.0
-5.8
118.9
120.5
-52.5
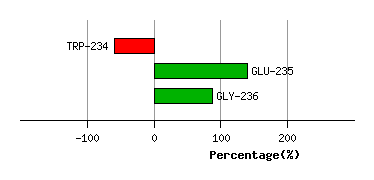
Graph shows rotational transition at bending residues and can be used
to identify hinge bending residues.
Probably only informative for interdomain rotations greater than 20 degrees