Beta-Agarase B
(All numbering and residues are taken from first PDB file)
![]()
![]()
Bending Residue Dihedral Analysis
Residue
iResidue
i+1Distance of hinge axis to residue i in
(A) Distance of hinge axis to residue i in
(A) Change in
(deg) Change in
(deg) Angle of psi(i) axis to hinge axis
(deg) Angle of psi(i) axis to hinge axis
(deg) Percentage Progress
HIS-215
VAL-216
5.6
5.6
-0.9
-0.5
53.2
50.4
44.0
VAL-216
PHE-217
7.5
7.4
-5.3
2.1
135.2
132.9
-21.5
PHE-217
ILE-218
10.9
10.9
-2.5
-1.6
75.4
72.5
118.7
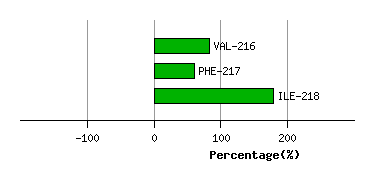
Graph shows rotational transition at bending residues and can be used
to identify hinge bending residues.
Probably only informative for interdomain rotations greater than 20 degrees
Residue
iResidue
i+1Distance of hinge axis to residue i in
(A) Distance of hinge axis to residue i in
(A) Change in
(deg) Change in
(deg) Angle of psi(i) axis to hinge axis
(deg) Angle of psi(i) axis to hinge axis
(deg) Percentage Progress
GLN-226
PRO-227
2.6
2.5
1.9
0.8
112.6
112.6
-42.8
PRO-227
LYS-228
1.3
1.3
-8.0
12.1
37.1
35.6
-194.0
LYS-228
ASP-229
2.4
2.3
-16.1
4.9
71.8
74.8
220.7
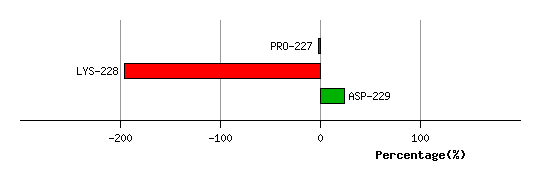
Graph shows rotational transition at bending residues and can be used
to identify hinge bending residues.
Probably only informative for interdomain rotations greater than 20 degrees
Residue
iResidue
i+1Distance of hinge axis to residue i in
(A) Distance of hinge axis to residue i in
(A) Change in
(deg) Change in
(deg) Angle of psi(i) axis to hinge axis
(deg) Angle of psi(i) axis to hinge axis
(deg) Percentage Progress
PHE-280
THR-281
11.5
11.4
0.8
-2.3
163.3
159.3
171.4
THR-281
ASN-282
11.0
11.1
-0.3
-2.6
58.3
60.1
22.6
ASN-282
THR-283
14.4
14.3
-2.5
-5.6
56.7
62.1
-46.2
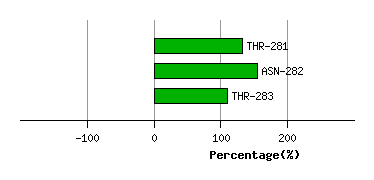
Graph shows rotational transition at bending residues and can be used
to identify hinge bending residues.
Probably only informative for interdomain rotations greater than 20 degrees
Residue
iResidue
i+1Distance of hinge axis to residue i in
(A) Distance of hinge axis to residue i in
(A) Change in
(deg) Change in
(deg) Angle of psi(i) axis to hinge axis
(deg) Angle of psi(i) axis to hinge axis
(deg) Percentage Progress
GLY-287
ASN-288
15.2
15.4
5.2
-12.3
94.8
97.5
65.7
ASN-288
THR-289
17.9
17.9
-3.3
15.0
102.4
111.8
84.0
THR-289
GLU-290
16.7
16.5
-15.2
1.4
103.8
110.5
-65.9
GLU-290
ILE-291
20.2
20.1
15.0
-3.0
7.1
11.3
169.7
ILE-291
ASP-292
19.7
19.5
-1.1
-14.1
109.2
110.5
-7.6
ASP-292
THR-293
16.6
16.5
1.4
-5.2
33.7
29.7
-81.7
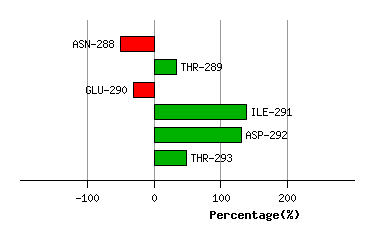
Graph shows rotational transition at bending residues and can be used
to identify hinge bending residues.
Probably only informative for interdomain rotations greater than 20 degrees