Beta-1,3-1,4-Glucanase
(All numbering and residues are taken from first PDB file)
![]()
![]()
Bending Residue Dihedral Analysis
Residue
iResidue
i+1Distance of hinge axis to residue i in
(A) Distance of hinge axis to residue i in
(A) Change in
(deg) Change in
(deg) Angle of psi(i) axis to hinge axis
(deg) Angle of psi(i) axis to hinge axis
(deg) Percentage Progress
TRP-101
THR-102
4.1
4.1
1.7
-7.9
131.2
132.6
134.0
THR-102
LEU-103
5.6
5.6
0.9
-1.3
129.5
133.1
-70.9
LEU-103
GLY-104
7.4
7.4
8.2
-13.6
147.2
143.9
144.3
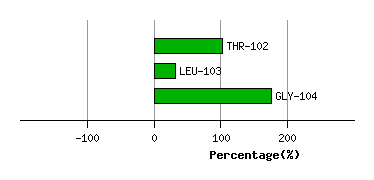
Graph shows rotational transition at bending residues and can be used
to identify hinge bending residues.
Probably only informative for interdomain rotations greater than 20 degrees
Residue
iResidue
i+1Distance of hinge axis to residue i in
(A) Distance of hinge axis to residue i in
(A) Change in
(deg) Change in
(deg) Angle of psi(i) axis to hinge axis
(deg) Angle of psi(i) axis to hinge axis
(deg) Percentage Progress
THR-105
GLY-106
11.2
11.3
6.1
1.0
45.8
46.9
93.2
GLY-106
ASP-107
12.8
12.7
6.0
-11.3
108.6
113.5
-27.1
ASP-107
TRP-108
13.4
13.1
-10.3
-2.5
70.8
68.1
74.6
TRP-108
PRO-109
11.7
11.1
6.0
15.1
51.2
59.5
55.0
PRO-109
TYR-110
9.3
9.0
-6.9
0.1
131.0
135.1
-84.0
TYR-110
GLY-111
7.8
7.8
-14.3
10.6
76.4
76.6
-0.2
GLY-111
GLY-112
6.6
6.7
1.0
3.4
130.8
127.7
-76.8
GLY-112
ALA-113
4.4
4.3
-1.8
2.3
19.9
18.2
-77.3
ALA-113
ILE-114
4.2
4.2
-7.6
4.4
62.3
62.4
90.0
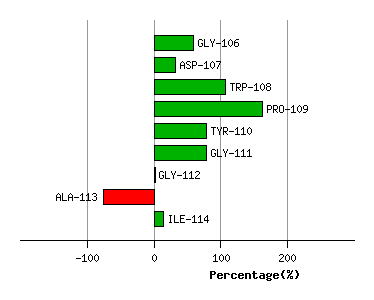
Graph shows rotational transition at bending residues and can be used
to identify hinge bending residues.
Probably only informative for interdomain rotations greater than 20 degrees
Residue
iResidue
i+1Distance of hinge axis to residue i in
(A) Distance of hinge axis to residue i in
(A) Change in
(deg) Change in
(deg) Angle of psi(i) axis to hinge axis
(deg) Angle of psi(i) axis to hinge axis
(deg) Percentage Progress
MET-128
VAL-129
5.4
5.4
0.4
-2.4
146.5
147.9
-41.6
VAL-129
LEU-130
5.6
5.6
0.1
-3.4
135.8
134.5
157.2
LEU-130
HIS-131
4.3
4.4
-1.3
2.1
67.4
66.9
42.3
HIS-131
THR-132
6.2
6.4
0.7
4.4
27.5
29.8
140.3
HIS-131
THR-132
6.2
6.4
0.7
4.4
27.5
29.8
140.3
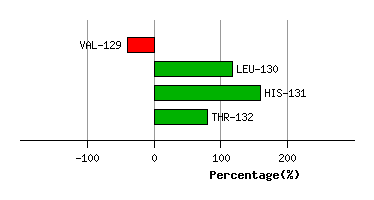
Graph shows rotational transition at bending residues and can be used
to identify hinge bending residues.
Probably only informative for interdomain rotations greater than 20 degrees
Residue
iResidue
i+1Distance of hinge axis to residue i in
(A) Distance of hinge axis to residue i in
(A) Change in
(deg) Change in
(deg) Angle of psi(i) axis to hinge axis
(deg) Angle of psi(i) axis to hinge axis
(deg) Percentage Progress
HIS-131
THR-132
6.2
6.4
0.7
4.4
27.5
29.8
140.3
HIS-131
THR-132
6.2
6.4
0.7
4.4
27.5
29.8
140.3
THR-132
SER-133
6.0
6.0
0.2
-4.9
51.9
53.5
-115.4
SER-133
ASP-134
7.9
8.0
2.6
0.1
72.9
68.7
90.4
ASP-134
GLY-135
9.6
9.6
0.1
-3.6
60.5
61.3
46.3
GLY-135
CYS-136
8.7
8.7
-3.2
5.9
56.7
57.2
-26.0
CYS-136
THR-137
7.7
7.7
9.4
-8.1
135.2
133.2
-22.5
THR-137
ILE-138
10.5
10.4
4.1
-4.3
105.9
106.0
-89.0
ILE-138
ASP-139
11.2
11.1
-3.8
18.7
84.8
85.5
2.7
ASP-139
ASN-140
14.5
14.3
-11.2
9.5
14.1
18.9
35.0
ASN-140
ASP-141
16.6
16.6
-21.6
-1.7
63.9
49.9
239.5
ASP-141
GLY-142
17.4
17.6
18.9
-2.9
99.9
93.4
-78.2
GLY-142
PHE-143
16.5
16.8
8.3
-12.8
148.8
144.9
61.7
PHE-143
THR-144
14.9
15.1
3.5
-1.5
137.6
138.5
-60.3
THR-144
GLY-145
16.0
16.1
6.9
-6.4
106.7
108.4
-48.9
GLY-145
ASN-146
13.9
13.9
-6.3
19.8
120.8
117.6
228.7
ASN-146
LEU-147
15.4
15.5
0.0
-3.6
56.3
48.6
-106.1
LEU-147
LYS-148
14.5
14.8
-4.5
3.5
78.3
77.9
-78.0
LYS-148
THR-149
14.9
14.8
1.2
-8.4
33.2
30.2
-209.9
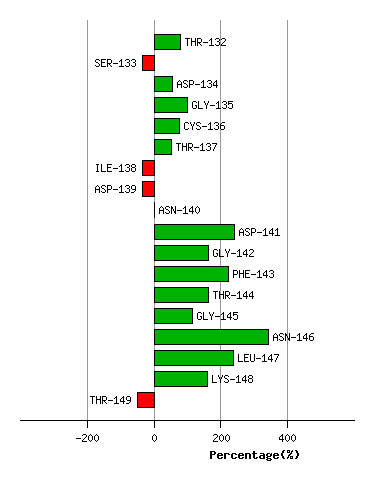
Graph shows rotational transition at bending residues and can be used
to identify hinge bending residues.
Probably only informative for interdomain rotations greater than 20 degrees
Residue
iResidue
i+1Distance of hinge axis to residue i in
(A) Distance of hinge axis to residue i in
(A) Change in
(deg) Change in
(deg) Angle of psi(i) axis to hinge axis
(deg) Angle of psi(i) axis to hinge axis
(deg) Percentage Progress
SER-150
ASN-151
13.3
13.4
-3.1
-1.0
46.6
48.5
117.1
ASN-151
CYS-152
12.0
12.0
4.3
-5.2
66.5
64.8
12.2
CYS-152
TYR-153
8.6
8.6
0.6
1.3
108.4
109.5
64.1
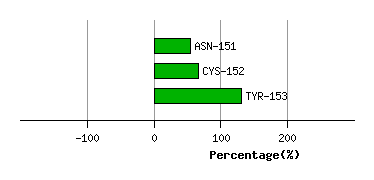
Graph shows rotational transition at bending residues and can be used
to identify hinge bending residues.
Probably only informative for interdomain rotations greater than 20 degrees
Residue
iResidue
i+1Distance of hinge axis to residue i in
(A) Distance of hinge axis to residue i in
(A) Change in
(deg) Change in
(deg) Angle of psi(i) axis to hinge axis
(deg) Angle of psi(i) axis to hinge axis
(deg) Percentage Progress
GLY-164
CYS-165
9.9
9.8
-4.6
1.0
83.7
84.8
56.4
CYS-165
GLY-166
9.6
9.6
4.6
-2.5
148.4
149.8
-42.3
GLY-166
ILE-167
9.5
9.6
0.4
-6.2
110.3
109.7
54.7
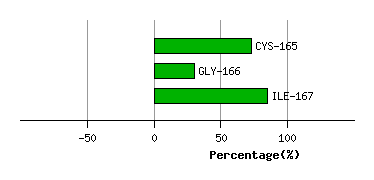
Graph shows rotational transition at bending residues and can be used
to identify hinge bending residues.
Probably only informative for interdomain rotations greater than 20 degrees
Residue
iResidue
i+1Distance of hinge axis to residue i in
(A) Distance of hinge axis to residue i in
(A) Change in
(deg) Change in
(deg) Angle of psi(i) axis to hinge axis
(deg) Angle of psi(i) axis to hinge axis
(deg) Percentage Progress
ALA-225
LYS-226
10.1
10.2
7.5
-8.9
146.7
145.0
-54.6
LYS-226
PHE-227
10.5
10.4
-2.1
-0.4
46.9
47.7
110.7
PHE-227
ALA-228
8.5
8.5
0.5
-0.4
152.2
150.9
33.5
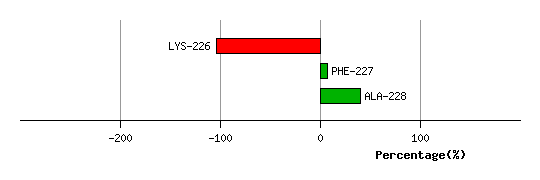
Graph shows rotational transition at bending residues and can be used
to identify hinge bending residues.
Probably only informative for interdomain rotations greater than 20 degrees
Residue
iResidue
i+1Distance of hinge axis to residue i in
(A) Distance of hinge axis to residue i in
(A) Change in
(deg) Change in
(deg) Angle of psi(i) axis to hinge axis
(deg) Angle of psi(i) axis to hinge axis
(deg) Percentage Progress
GLY-229
GLY-230
12.0
11.9
9.5
-0.5
26.6
29.1
150.6
GLY-230
GLY-231
11.6
11.4
-3.8
13.5
96.1
91.0
8.2
GLY-231
CYS-232
10.7
10.6
-10.0
0.1
78.4
83.5
-4.4
CYS-232
ASP-233
6.9
6.8
-1.4
3.6
113.8
113.7
-3.6
ASP-233
TRP-234
4.1
4.2
0.4
2.0
139.7
139.7
-63.1
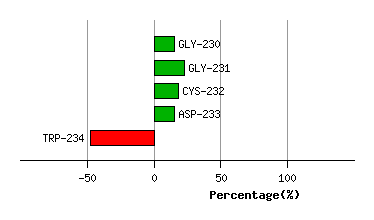
Graph shows rotational transition at bending residues and can be used
to identify hinge bending residues.
Probably only informative for interdomain rotations greater than 20 degrees
Residue
iResidue
i+1Distance of hinge axis to residue i in
(A) Distance of hinge axis to residue i in
(A) Change in
(deg) Change in
(deg) Angle of psi(i) axis to hinge axis
(deg) Angle of psi(i) axis to hinge axis
(deg) Percentage Progress
GLU-235
GLY-236
4.5
4.6
-0.8
4.2
101.3
104.0
10.4
GLY-236
LYS-237
1.9
1.9
1.2
-8.8
131.7
129.4
186.2
LYS-237
PHE-238
1.4
1.3
3.0
0.3
139.6
140.0
-83.9
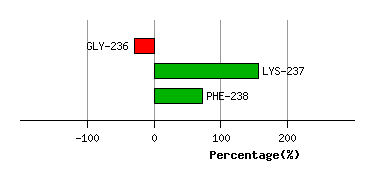
Graph shows rotational transition at bending residues and can be used
to identify hinge bending residues.
Probably only informative for interdomain rotations greater than 20 degrees