Vitamin D-Binding Protein
(All numbering and residues are taken from first PDB file)
![]()
![]()
Bending Residue Dihedral Analysis
Residue
iResidue
i+1Distance of hinge axis to residue i in
(A) Distance of hinge axis to residue i in
(A) Change in
(deg) Change in
(deg) Angle of psi(i) axis to hinge axis
(deg) Angle of psi(i) axis to hinge axis
(deg) Percentage Progress
GLN-131
GLU-132
4.1
4.8
-0.3
1.2
59.8
51.9
-8.3
GLU-132
PHE-133
5.5
5.3
5.8
2.5
55.3
62.3
37.4
PHE-133
PRO-134
5.8
5.5
7.3
-3.6
53.4
56.2
9.8
PRO-134
THR-135
3.1
2.9
3.3
-14.0
42.8
46.8
-77.7
THR-135
TYR-136
4.4
4.4
20.0
-5.2
73.5
73.1
37.8
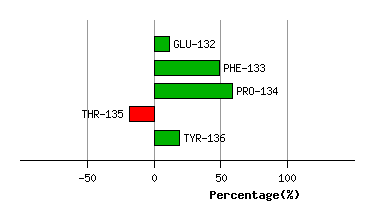
Graph shows rotational transition at bending residues and can be used
to identify hinge bending residues.
Probably only informative for interdomain rotations greater than 20 degrees
Residue
iResidue
i+1Distance of hinge axis to residue i in
(A) Distance of hinge axis to residue i in
(A) Change in
(deg) Change in
(deg) Angle of psi(i) axis to hinge axis
(deg) Angle of psi(i) axis to hinge axis
(deg) Percentage Progress
LEU-211
LEU-212
11.2
10.9
-0.2
-2.8
63.8
58.4
1.1
LEU-212
THR-213
10.2
9.8
4.7
-0.8
50.7
55.1
11.6
THR-213
THR-214
9.0
8.6
7.3
-11.6
76.0
74.7
28.6
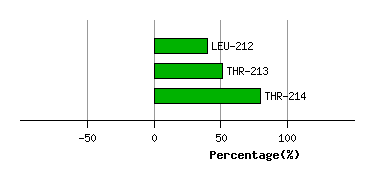
Graph shows rotational transition at bending residues and can be used
to identify hinge bending residues.
Probably only informative for interdomain rotations greater than 20 degrees