Beta-Agarase B
(All numbering and residues are taken from first PDB file)
![]()
![]()
Bending Residue Dihedral Analysis
Residue
iResidue
i+1Distance of hinge axis to residue i in
(A) Distance of hinge axis to residue i in
(A) Change in
(deg) Change in
(deg) Angle of psi(i) axis to hinge axis
(deg) Angle of psi(i) axis to hinge axis
(deg) Percentage Progress
HIS-211
ILE-212
5.7
5.7
0.3
4.9
12.6
14.4
34.9
ILE-212
SER-213
5.3
5.3
-14.0
10.4
108.2
111.7
-136.1
SER-213
HIS-214
2.1
1.9
5.6
0.4
22.1
24.2
187.0
HIS-214
HIS-215
1.6
1.7
10.0
-7.0
99.8
98.4
-59.6
HIS-215
VAL-216
4.9
4.9
2.1
-0.3
25.9
28.9
89.8
VAL-216
PHE-217
7.1
7.2
8.9
-4.2
109.0
111.0
-71.2
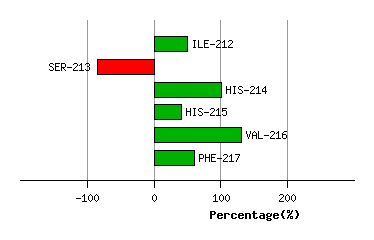
Graph shows rotational transition at bending residues and can be used
to identify hinge bending residues.
Probably only informative for interdomain rotations greater than 20 degrees
Residue
iResidue
i+1Distance of hinge axis to residue i in
(A) Distance of hinge axis to residue i in
(A) Change in
(deg) Change in
(deg) Angle of psi(i) axis to hinge axis
(deg) Angle of psi(i) axis to hinge axis
(deg) Percentage Progress
LYS-228
ASP-229
4.5
4.4
13.2
-2.3
52.9
53.2
304.7
ASP-229
ALA-230
5.9
6.0
-4.2
11.0
112.4
114.0
-38.5
ALA-230
GLY-231
5.3
5.4
-4.8
-2.9
59.3
58.1
133.0
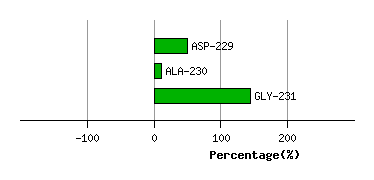
Graph shows rotational transition at bending residues and can be used
to identify hinge bending residues.
Probably only informative for interdomain rotations greater than 20 degrees
Residue
iResidue
i+1Distance of hinge axis to residue i in
(A) Distance of hinge axis to residue i in
(A) Change in
(deg) Change in
(deg) Angle of psi(i) axis to hinge axis
(deg) Angle of psi(i) axis to hinge axis
(deg) Percentage Progress
VAL-269
SER-270
7.7
7.7
12.9
-12.6
23.9
24.8
32.0
SER-270
GLY-271
9.7
9.5
-5.8
1.6
91.8
92.6
-28.3
GLY-271
LYS-272
10.9
10.7
5.2
3.2
98.8
100.3
141.5
LYS-272
ASP-273
10.9
10.9
-5.1
7.4
26.7
24.2
-42.5
ASP-273
ILE-274
12.2
12.2
-5.2
1.0
52.0
52.7
-9.1
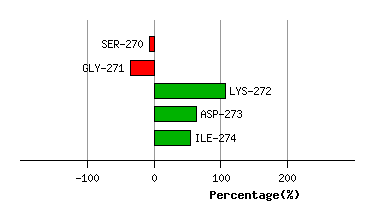
Graph shows rotational transition at bending residues and can be used
to identify hinge bending residues.
Probably only informative for interdomain rotations greater than 20 degrees
Residue
iResidue
i+1Distance of hinge axis to residue i in
(A) Distance of hinge axis to residue i in
(A) Change in
(deg) Change in
(deg) Angle of psi(i) axis to hinge axis
(deg) Angle of psi(i) axis to hinge axis
(deg) Percentage Progress
THR-295
GLY-296
7.6
7.7
0.5
-1.3
54.7
52.5
7.1
GLY-296
LEU-297
5.7
5.8
-6.9
11.0
84.5
82.4
74.1
LEU-297
ASN-298
2.1
2.1
-5.4
4.4
24.3
24.3
-5.8
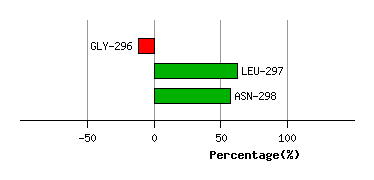
Graph shows rotational transition at bending residues and can be used
to identify hinge bending residues.
Probably only informative for interdomain rotations greater than 20 degrees