Protein Calg3
(All numbering and residues are taken from first PDB file)
![]()
![]()
Bending Residue Dihedral Analysis
Residue
iResidue
i+1Distance of hinge axis to residue i in
(A) Distance of hinge axis to residue i in
(A) Change in
(deg) Change in
(deg) Angle of psi(i) axis to hinge axis
(deg) Angle of psi(i) axis to hinge axis
(deg) Percentage Progress
ASN-67
PRO-68
25.9
25.3
-9.9
-6.8
135.2
132.9
-58.3
PRO-68
ARG-69
25.1
24.4
15.6
-5.3
73.9
62.0
6.9
ARG-69
PHE-70
22.2
22.5
-8.4
7.5
49.2
55.0
12.4
PHE-70
ALA-71
20.5
20.4
-1.9
10.4
91.6
88.5
-6.4
ALA-71
GLU-72
21.2
19.9
-11.6
6.2
142.5
139.7
32.0
GLU-72
THR-73
19.7
18.6
0.1
2.6
82.5
76.9
-69.9
THR-73
VAL-74
16.4
16.3
-5.6
3.6
28.4
38.8
46.8
VAL-74
ALA-75
15.4
15.2
1.6
-9.9
121.1
120.2
57.5
ALA-75
THR-76
17.0
15.3
18.7
17.8
76.1
63.3
-4.9
THR-76
ARG-77
15.5
13.1
-10.2
11.8
97.3
78.5
5.1
ARG-77
PRO-78
11.7
10.0
-2.7
-0.7
30.9
5.1
26.5
PRO-78
ALA-79
8.9
8.5
12.7
-17.8
103.5
115.6
8.7
ALA-79
ILE-80
9.6
10.4
-43.2
-13.0
90.3
62.7
156.4
ILE-80
ASP-81
8.2
9.0
-22.2
51.4
38.6
71.9
-103.4
ASP-81
LEU-82
10.9
12.4
-50.7
-0.1
64.0
75.0
7.6
LEU-82
GLU-83
13.0
14.4
18.3
11.5
69.8
80.4
68.8
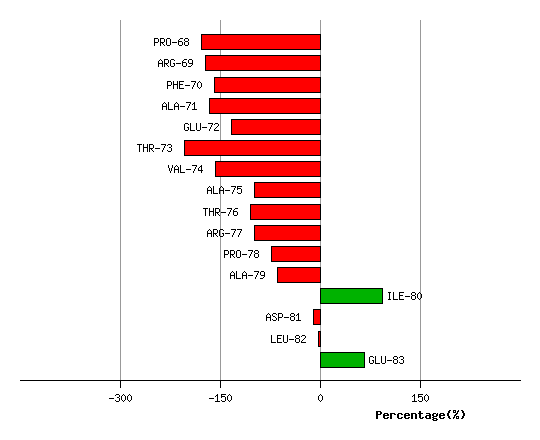
Graph shows rotational transition at bending residues and can be used
to identify hinge bending residues.
Probably only informative for interdomain rotations greater than 20 degrees
Residue
iResidue
i+1Distance of hinge axis to residue i in
(A) Distance of hinge axis to residue i in
(A) Change in
(deg) Change in
(deg) Angle of psi(i) axis to hinge axis
(deg) Angle of psi(i) axis to hinge axis
(deg) Percentage Progress
VAL-133
GLN-134
16.4
16.5
3.7
-4.5
53.0
49.8
15.6
GLN-134
ARG-135
14.4
14.6
-14.5
12.6
80.9
85.3
-2.3
ARG-135
ASN-136
10.9
11.0
-5.4
17.0
152.5
156.9
116.6
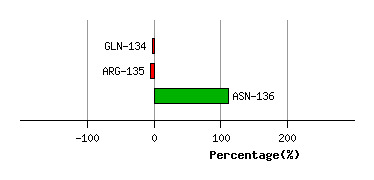
Graph shows rotational transition at bending residues and can be used
to identify hinge bending residues.
Probably only informative for interdomain rotations greater than 20 degrees
Residue
iResidue
i+1Distance of hinge axis to residue i in
(A) Distance of hinge axis to residue i in
(A) Change in
(deg) Change in
(deg) Angle of psi(i) axis to hinge axis
(deg) Angle of psi(i) axis to hinge axis
(deg) Percentage Progress
GLN-137
SER-138
6.5
7.6
154.6
-161.0
125.8
141.0
101.7
SER-138
ALA-139
4.3
4.6
25.0
-36.9
116.3
103.1
68.3
ALA-139
TRP-140
4.3
5.2
27.1
-1.3
114.7
118.3
-87.8
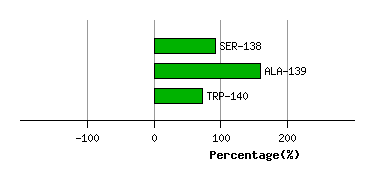
Graph shows rotational transition at bending residues and can be used
to identify hinge bending residues.
Probably only informative for interdomain rotations greater than 20 degrees
Residue
iResidue
i+1Distance of hinge axis to residue i in
(A) Distance of hinge axis to residue i in
(A) Change in
(deg) Change in
(deg) Angle of psi(i) axis to hinge axis
(deg) Angle of psi(i) axis to hinge axis
(deg) Percentage Progress
THR-170
ILE-171
13.4
13.9
24.9
-26.4
105.5
105.9
10.8
ILE-171
GLU-172
9.9
10.2
0.7
14.9
48.5
41.2
94.8
GLU-172
SER-173
7.2
7.8
7.4
-3.7
112.1
107.2
22.0
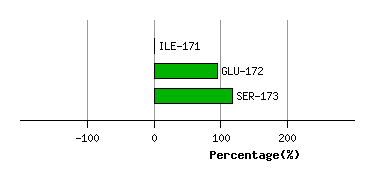
Graph shows rotational transition at bending residues and can be used
to identify hinge bending residues.
Probably only informative for interdomain rotations greater than 20 degrees
Residue
iResidue
i+1Distance of hinge axis to residue i in
(A) Distance of hinge axis to residue i in
(A) Change in
(deg) Change in
(deg) Angle of psi(i) axis to hinge axis
(deg) Angle of psi(i) axis to hinge axis
(deg) Percentage Progress
LEU-178
LEU-179
6.8
5.9
19.5
12.1
121.4
112.5
-127.8
LEU-179
LEU-180
7.9
7.2
-136.7
147.0
54.3
37.7
-82.9
LEU-180
GLU-181
10.2
9.3
-106.8
45.3
95.9
90.2
-75.7
GLU-181
ALA-182
12.1
12.1
-136.7
21.4
156.8
102.6
-545.7
ALA-182
GLU-183
13.4
11.3
-15.0
9.8
91.8
149.6
-96.5
GLU-183
PRO-184
14.1
13.9
-19.8
-0.3
115.2
138.2
-158.5
PRO-184
GLU-185
17.7
12.6
13.9
-150.3
15.5
75.1
1447.1
GLU-185
GLY-186
17.4
13.9
-48.9
-107.5
99.1
164.8
-1125.9
GLY-186
TRP-187
13.7
13.9
85.6
36.1
35.8
62.8
716.6
TRP-187
PHE-188
12.0
11.8
9.1
16.0
99.9
106.8
-26.1
PHE-188
MET-189
8.9
8.6
5.3
0.2
28.9
29.3
35.4
MET-189
ARG-190
6.1
5.7
-2.2
-7.8
81.9
81.4
31.6
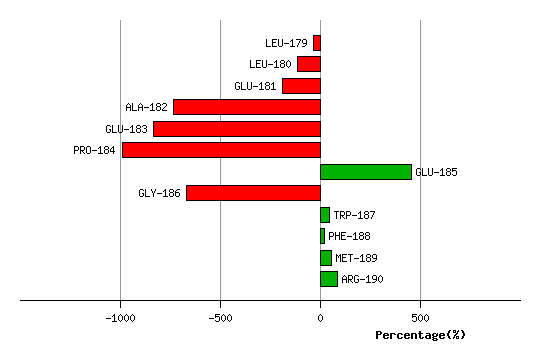
Graph shows rotational transition at bending residues and can be used
to identify hinge bending residues.
Probably only informative for interdomain rotations greater than 20 degrees
Residue
iResidue
i+1Distance of hinge axis to residue i in
(A) Distance of hinge axis to residue i in
(A) Change in
(deg) Change in
(deg) Angle of psi(i) axis to hinge axis
(deg) Angle of psi(i) axis to hinge axis
(deg) Percentage Progress
LEU-204
PRO-205
21.6
21.8
-34.9
-3.7
139.0
139.5
-179.5
PRO-205
PRO-206
23.0
23.4
-9.6
-21.5
85.4
105.7
-32.1
PRO-206
VAL-207
25.4
24.4
16.4
15.5
55.4
13.3
184.1
VAL-207
PRO-208
24.4
23.6
12.3
-3.0
50.8
66.7
72.4
PRO-208
ALA-209
26.4
26.5
0.4
-17.9
94.7
69.3
-41.2
ALA-209
ARG-210
29.0
29.1
1.3
49.1
67.0
15.7
303.5
ARG-210
PRO-211
26.9
28.2
-3.4
-2.3
105.0
93.7
20.0
PRO-211
GLU-212
23.1
24.6
-4.1
-13.9
152.2
105.2
-89.2
GLU-212
VAL-213
22.5
22.8
-26.1
-16.7
123.1
115.4
-77.9
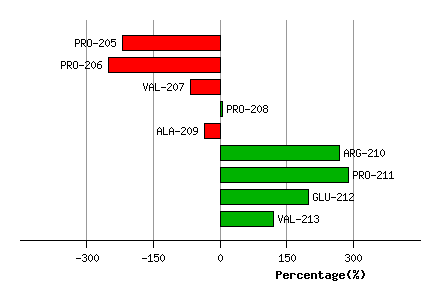
Graph shows rotational transition at bending residues and can be used
to identify hinge bending residues.
Probably only informative for interdomain rotations greater than 20 degrees
Residue
iResidue
i+1Distance of hinge axis to residue i in
(A) Distance of hinge axis to residue i in
(A) Change in
(deg) Change in
(deg) Angle of psi(i) axis to hinge axis
(deg) Angle of psi(i) axis to hinge axis
(deg) Percentage Progress
THR-219
ILE-220
19.2
16.8
41.2
-61.7
131.3
129.4
147.2
ILE-220
GLU-221
18.6
17.5
14.7
-9.8
157.3
160.2
-74.3
GLU-221
LEU-222
16.8
16.6
2.5
-19.9
111.9
107.6
42.0
LEU-222
GLN-223
20.0
19.8
13.3
13.4
108.3
79.3
-51.3
GLN-223
ALA-224
22.2
21.8
-7.8
-12.4
35.5
39.3
104.8
ALA-224
PHE-225
20.1
21.0
4.9
1.1
142.7
154.5
-56.9
PHE-225
GLY-226
19.6
20.5
7.1
12.5
95.5
93.8
17.9
GLY-226
ILE-227
22.7
23.1
-3.9
0.5
102.4
105.7
-6.5
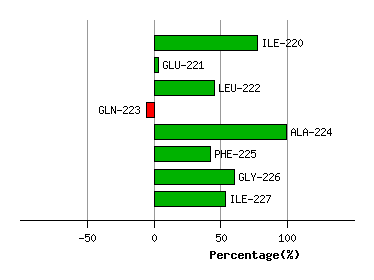
Graph shows rotational transition at bending residues and can be used
to identify hinge bending residues.
Probably only informative for interdomain rotations greater than 20 degrees
Residue
iResidue
i+1Distance of hinge axis to residue i in
(A) Distance of hinge axis to residue i in
(A) Change in
(deg) Change in
(deg) Angle of psi(i) axis to hinge axis
(deg) Angle of psi(i) axis to hinge axis
(deg) Percentage Progress
THR-289
VAL-290
7.7
8.3
2.1
9.9
97.8
103.1
46.9
VAL-290
MET-291
5.3
5.7
-6.1
8.3
147.2
148.0
20.2
MET-291
THR-292
3.8
4.0
-7.1
2.6
133.4
132.3
-29.6
THR-292
ALA-293
6.9
7.2
1.2
0.5
104.9
107.9
-2.0
ALA-293
ILE-294
9.1
9.3
-1.9
2.0
105.8
102.7
-20.3
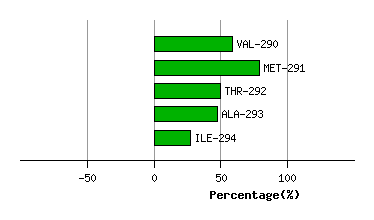
Graph shows rotational transition at bending residues and can be used
to identify hinge bending residues.
Probably only informative for interdomain rotations greater than 20 degrees
Residue
iResidue
i+1Distance of hinge axis to residue i in
(A) Distance of hinge axis to residue i in
(A) Change in
(deg) Change in
(deg) Angle of psi(i) axis to hinge axis
(deg) Angle of psi(i) axis to hinge axis
(deg) Percentage Progress
PHE-310
GLN-311
8.8
10.4
-29.4
3.9
111.1
118.6
-79.1
GLN-311
HIS-312
5.8
7.7
32.5
-42.1
114.2
113.2
-2.1
HIS-312
THR-313
3.4
4.7
20.8
4.7
53.6
61.2
167.5
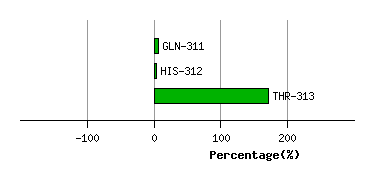
Graph shows rotational transition at bending residues and can be used
to identify hinge bending residues.
Probably only informative for interdomain rotations greater than 20 degrees
Residue
iResidue
i+1Distance of hinge axis to residue i in
(A) Distance of hinge axis to residue i in
(A) Change in
(deg) Change in
(deg) Angle of psi(i) axis to hinge axis
(deg) Angle of psi(i) axis to hinge axis
(deg) Percentage Progress
ALA-314
ARG-315
1.3
0.8
30.0
-9.8
56.8
45.8
232.2
ARG-315
GLU-316
2.7
2.5
3.1
-0.6
82.7
72.8
21.9
GLU-316
ALA-317
2.9
3.4
-1.0
-7.4
34.8
42.7
44.9
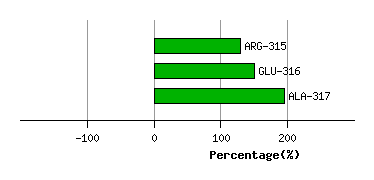
Graph shows rotational transition at bending residues and can be used
to identify hinge bending residues.
Probably only informative for interdomain rotations greater than 20 degrees
Residue
iResidue
i+1Distance of hinge axis to residue i in
(A) Distance of hinge axis to residue i in
(A) Change in
(deg) Change in
(deg) Angle of psi(i) axis to hinge axis
(deg) Angle of psi(i) axis to hinge axis
(deg) Percentage Progress
ALA-359
LEU-360
10.5
9.5
7.3
1.8
88.4
91.0
-9.3
LEU-360
PRO-361
8.6
7.8
4.7
-5.9
30.5
33.2
13.0
PRO-361
THR-362
7.9
7.6
-1.7
-4.0
90.4
98.2
64.7
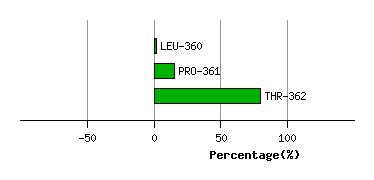
Graph shows rotational transition at bending residues and can be used
to identify hinge bending residues.
Probably only informative for interdomain rotations greater than 20 degrees