Udp-Galactose 4-Epimerase
(All numbering and residues are taken from first PDB file)
![]()
![]()
Bending Residue Dihedral Analysis
Residue
iResidue
i+1Distance of hinge axis to residue i in
(A) Distance of hinge axis to residue i in
(A) Change in
(deg) Change in
(deg) Angle of psi(i) axis to hinge axis
(deg) Angle of psi(i) axis to hinge axis
(deg) Percentage Progress
GLN-140
TYR-141
14.8
14.3
-18.5
28.1
73.2
84.3
-43.5
TYR-141
LEU-142
11.7
11.1
-11.4
34.5
117.7
124.8
38.3
LEU-142
PRO-143
8.4
8.1
1.5
-5.3
116.9
125.7
-4.8
PRO-143
LEU-144
5.6
5.3
10.0
1.7
121.5
118.3
-3.1
LEU-144
ASP-145
7.1
7.2
2.0
8.1
131.8
132.8
-50.0
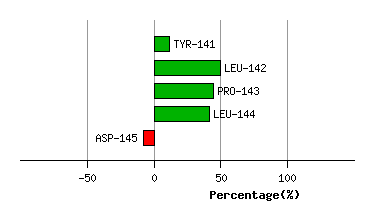
Graph shows rotational transition at bending residues and can be used
to identify hinge bending residues.
Probably only informative for interdomain rotations greater than 20 degrees
Residue
iResidue
i+1Distance of hinge axis to residue i in
(A) Distance of hinge axis to residue i in
(A) Change in
(deg) Change in
(deg) Angle of psi(i) axis to hinge axis
(deg) Angle of psi(i) axis to hinge axis
(deg) Percentage Progress
GLU-221
ALA-222
4.8
5.0
14.1
16.5
133.1
125.5
-137.5
ALA-222
LEU-223
4.4
5.1
-8.1
-29.3
34.2
14.9
237.6
LEU-223
ASN-224
5.4
5.1
-29.1
19.3
85.9
75.3
4.9
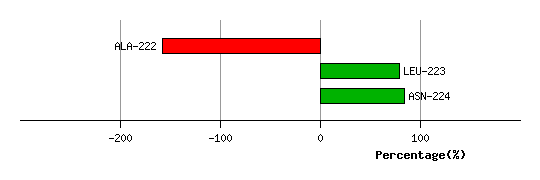
Graph shows rotational transition at bending residues and can be used
to identify hinge bending residues.
Probably only informative for interdomain rotations greater than 20 degrees
Residue
iResidue
i+1Distance of hinge axis to residue i in
(A) Distance of hinge axis to residue i in
(A) Change in
(deg) Change in
(deg) Angle of psi(i) axis to hinge axis
(deg) Angle of psi(i) axis to hinge axis
(deg) Percentage Progress
VAL-238
ARG-239
6.4
6.0
1.6
7.8
60.6
71.9
13.4
ARG-239
ASP-240
4.3
4.3
24.5
-25.6
65.7
63.5
44.4
ASP-240
TYR-241
2.3
2.9
20.5
-41.1
118.2
114.9
38.3
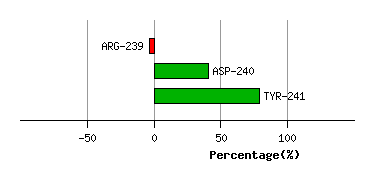
Graph shows rotational transition at bending residues and can be used
to identify hinge bending residues.
Probably only informative for interdomain rotations greater than 20 degrees
Residue
iResidue
i+1Distance of hinge axis to residue i in
(A) Distance of hinge axis to residue i in
(A) Change in
(deg) Change in
(deg) Angle of psi(i) axis to hinge axis
(deg) Angle of psi(i) axis to hinge axis
(deg) Percentage Progress
TYR-275
SER-276
3.3
3.0
-9.2
0.2
126.0
132.0
-36.8
SER-276
VAL-277
5.3
5.0
-4.8
-6.6
147.4
152.5
-52.2
VAL-277
LEU-278
4.6
4.2
9.3
6.0
52.0
57.4
40.9
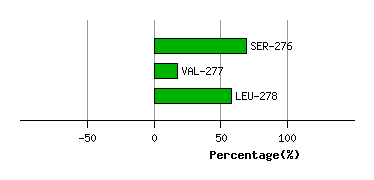
Graph shows rotational transition at bending residues and can be used
to identify hinge bending residues.
Probably only informative for interdomain rotations greater than 20 degrees
Residue
iResidue
i+1Distance of hinge axis to residue i in
(A) Distance of hinge axis to residue i in
(A) Change in
(deg) Change in
(deg) Angle of psi(i) axis to hinge axis
(deg) Angle of psi(i) axis to hinge axis
(deg) Percentage Progress
GLN-279
MET-280
5.4
6.3
-6.9
2.4
76.2
62.9
8.2
MET-280
VAL-281
2.1
3.4
-4.7
-4.3
14.6
14.0
42.4
VAL-281
GLN-282
2.4
4.0
4.9
1.6
97.7
98.2
-13.1
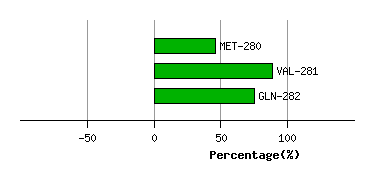
Graph shows rotational transition at bending residues and can be used
to identify hinge bending residues.
Probably only informative for interdomain rotations greater than 20 degrees
Residue
iResidue
i+1Distance of hinge axis to residue i in
(A) Distance of hinge axis to residue i in
(A) Change in
(deg) Change in
(deg) Angle of psi(i) axis to hinge axis
(deg) Angle of psi(i) axis to hinge axis
(deg) Percentage Progress
ILE-292
PRO-293
2.0
2.4
34.1
-11.7
82.7
63.6
37.0
PRO-293
TYR-294
3.2
3.0
-69.5
81.1
56.8
59.7
-45.5
TYR-294
LYS-295
5.6
5.4
-29.3
27.8
104.3
119.1
-20.5
LYS-295
VAL-296
9.3
8.7
-41.3
19.4
36.1
36.3
108.7
VAL-296
VAL-297
11.9
11.2
-7.2
1.5
103.1
99.5
-14.1
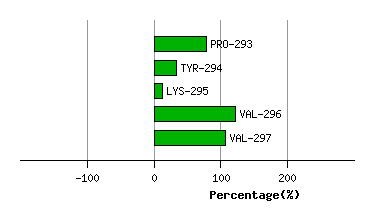
Graph shows rotational transition at bending residues and can be used
to identify hinge bending residues.
Probably only informative for interdomain rotations greater than 20 degrees
Residue
iResidue
i+1Distance of hinge axis to residue i in
(A) Distance of hinge axis to residue i in
(A) Change in
(deg) Change in
(deg) Angle of psi(i) axis to hinge axis
(deg) Angle of psi(i) axis to hinge axis
(deg) Percentage Progress
CYS-307
TYR-308
7.5
7.2
-13.7
-4.2
95.4
101.3
-61.5
TYR-308
ALA-309
4.2
4.2
-0.6
-2.2
163.1
164.0
-46.1
ALA-309
ASN-310
3.6
4.5
-5.8
20.2
134.9
129.6
148.3
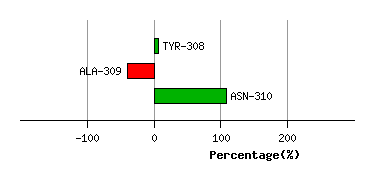
Graph shows rotational transition at bending residues and can be used
to identify hinge bending residues.
Probably only informative for interdomain rotations greater than 20 degrees
Residue
iResidue
i+1Distance of hinge axis to residue i in
(A) Distance of hinge axis to residue i in
(A) Change in
(deg) Change in
(deg) Angle of psi(i) axis to hinge axis
(deg) Angle of psi(i) axis to hinge axis
(deg) Percentage Progress
GLY-319
TRP-320
13.6
13.3
-3.1
20.1
169.5
168.1
100.3
THR-321
ALA-322
10.5
10.5
-2.5
-42.7
166.4
101.0
-112.1
ALA-322
ALA-323
10.0
13.5
-133.1
-48.7
99.9
169.8
647.2
ALA-323
LEU-324
12.3
12.9
66.9
-36.4
33.6
65.6
167.2
LEU-324
GLY-325
11.7
9.1
-118.6
32.2
103.3
101.5
-82.7
GLY-325
LEU-326
9.5
9.3
-32.9
-6.7
160.8
161.9
-183.4
LEU-326
ASP-327
7.6
7.6
8.7
-3.1
41.3
48.5
17.5
ASP-327
ARG-328
10.7
11.0
4.4
-7.8
80.9
86.5
-9.4
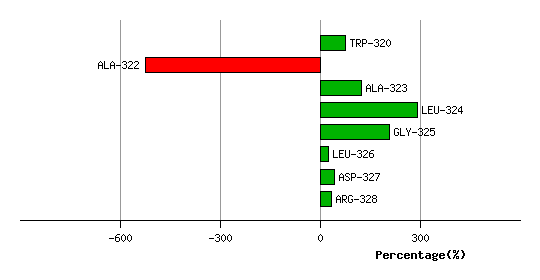
Graph shows rotational transition at bending residues and can be used
to identify hinge bending residues.
Probably only informative for interdomain rotations greater than 20 degrees