Cytochrome P450-Cam
(All numbering and residues are taken from first PDB file)
![]()
![]()
Bending Residue Dihedral Analysis
Residue
iResidue
i+1Distance of hinge axis to residue i in
(A) Distance of hinge axis to residue i in
(A) Change in
(deg) Change in
(deg) Angle of psi(i) axis to hinge axis
(deg) Angle of psi(i) axis to hinge axis
(deg) Percentage Progress
GLU-156
PRO-157
8.6
8.5
7.4
-1.0
71.5
71.9
-7.4
PRO-157
PHE-158
9.0
8.9
7.2
-3.4
77.3
74.2
71.7
PHE-158
PRO-159
5.8
5.6
6.8
3.7
22.5
18.0
10.3
PRO-159
ILE-160
3.8
4.1
-4.2
-4.9
135.6
135.2
-3.4
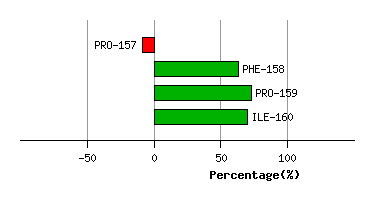
Graph shows rotational transition at bending residues and can be used
to identify hinge bending residues.
Probably only informative for interdomain rotations greater than 20 degrees
Residue
iResidue
i+1Distance of hinge axis to residue i in
(A) Distance of hinge axis to residue i in
(A) Change in
(deg) Change in
(deg) Angle of psi(i) axis to hinge axis
(deg) Angle of psi(i) axis to hinge axis
(deg) Percentage Progress
GLY-226
GLN-227
5.9
5.8
-9.2
-10.8
26.7
20.5
124.1
GLN-227
VAL-228
5.8
5.5
5.2
-3.8
76.7
84.8
4.9
VAL-228
ASN-229
4.7
4.5
11.3
5.0
157.4
160.1
-149.6
ASN-229
GLY-230
7.0
6.3
-18.4
13.2
47.2
47.0
98.7
GLY-230
ARG-231
7.8
7.1
10.7
-17.7
107.4
102.3
17.0
ARG-231
PRO-232
4.7
4.1
-13.8
8.8
144.2
149.0
-48.3
PRO-232
ILE-233
4.2
4.3
-6.7
5.5
110.4
111.8
42.1
ILE-233
THR-234
2.1
2.2
-3.7
-3.2
69.7
77.5
15.1
THR-234
SER-235
4.6
4.8
-4.0
5.5
144.7
146.4
-11.2
SER-235
ASP-236
7.8
7.8
4.7
1.1
57.4
63.0
26.4
ASP-236
GLU-237
8.3
8.2
0.7
-7.3
124.1
126.1
29.5
ASP-236
GLU-237
8.3
8.2
0.7
-7.3
124.1
126.1
29.5
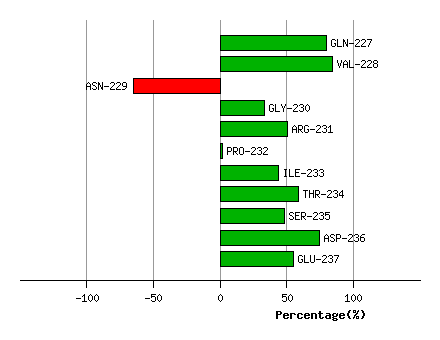
Graph shows rotational transition at bending residues and can be used
to identify hinge bending residues.
Probably only informative for interdomain rotations greater than 20 degrees
Residue
iResidue
i+1Distance of hinge axis to residue i in
(A) Distance of hinge axis to residue i in
(A) Change in
(deg) Change in
(deg) Angle of psi(i) axis to hinge axis
(deg) Angle of psi(i) axis to hinge axis
(deg) Percentage Progress
ASP-236
GLU-237
8.3
8.2
0.7
-7.3
124.1
126.1
29.5
ASP-236
GLU-237
8.3
8.2
0.7
-7.3
124.1
126.1
29.5
GLU-237
ALA-238
5.1
5.0
4.9
3.2
147.9
144.7
-48.8
ALA-238
LYS-239
4.8
4.7
-4.8
-4.8
47.8
40.6
76.9
LYS-239
ARG-240
8.0
7.7
8.1
-1.7
120.0
116.9
-32.3
ARG-240
MET-241
7.6
7.3
8.3
-12.4
129.6
126.4
0.6
MET-241
CYS-242
4.2
3.9
9.8
-5.5
144.6
145.1
-21.1
CYS-242
GLY-243
5.4
5.0
1.1
2.3
123.8
129.3
3.2
GLY-243
LEU-244
8.3
7.6
-5.2
0.8
50.8
49.3
14.8
LEU-244
LEU-245
6.7
6.0
2.2
0.1
138.6
131.0
-20.8
LEU-245
LEU-246
3.8
2.9
8.6
-12.3
137.0
142.0
40.4
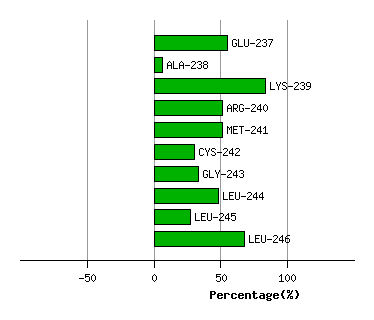
Graph shows rotational transition at bending residues and can be used
to identify hinge bending residues.
Probably only informative for interdomain rotations greater than 20 degrees
Residue
iResidue
i+1Distance of hinge axis to residue i in
(A) Distance of hinge axis to residue i in
(A) Change in
(deg) Change in
(deg) Angle of psi(i) axis to hinge axis
(deg) Angle of psi(i) axis to hinge axis
(deg) Percentage Progress
LEU-250
ASP-251
7.5
6.5
-45.1
65.7
125.7
124.1
100.4
ASP-251
THR-252
9.0
9.5
-54.8
53.5
112.1
118.7
2.0
THR-252
VAL-253
7.4
8.3
13.7
-3.4
26.4
35.0
69.4
VAL-253
VAL-254
4.7
5.2
-9.6
-1.1
135.0
139.5
-84.2
VAL-254
ASN-255
6.5
7.1
-1.8
-0.8
124.3
125.0
-24.4
ASN-255
PHE-256
9.4
9.8
8.6
-11.4
58.6
65.4
-3.5
PHE-256
LEU-257
8.3
8.6
-0.9
1.5
151.6
147.2
9.0
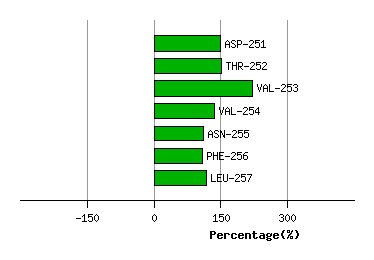
Graph shows rotational transition at bending residues and can be used
to identify hinge bending residues.
Probably only informative for interdomain rotations greater than 20 degrees