4-Alpha-Glucanotransferase
(All numbering and residues are taken from first PDB file)
![]()
![]()
Bending Residue Dihedral Analysis
Residue
iResidue
i+1Distance of hinge axis to residue i in
(A) Distance of hinge axis to residue i in
(A) Change in
(deg) Change in
(deg) Angle of psi(i) axis to hinge axis
(deg) Angle of psi(i) axis to hinge axis
(deg) Percentage Progress
HIS-11
ASN-12
8.2
7.9
-0.3
1.8
155.6
152.3
2.2
ASN-12
HIS-13
6.3
5.9
0.0
-4.4
87.0
85.9
15.9
HIS-13
GLN-14
3.6
3.1
-9.3
12.7
140.9
139.3
54.8
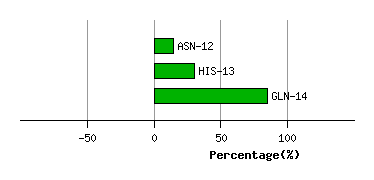
Graph shows rotational transition at bending residues and can be used
to identify hinge bending residues.
Probably only informative for interdomain rotations greater than 20 degrees
Residue
iResidue
i+1Distance of hinge axis to residue i in
(A) Distance of hinge axis to residue i in
(A) Change in
(deg) Change in
(deg) Angle of psi(i) axis to hinge axis
(deg) Angle of psi(i) axis to hinge axis
(deg) Percentage Progress
VAL-22
PHE-23
5.5
5.3
-5.0
-3.0
114.3
113.5
-34.0
PHE-23
GLU-24
2.3
1.9
-1.9
-0.4
51.2
53.0
11.8
GLU-24
GLU-25
3.0
2.8
-0.1
0.2
92.3
92.0
-43.3
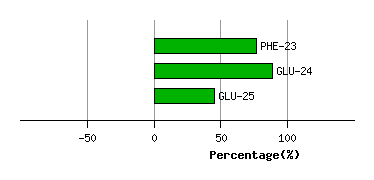
Graph shows rotational transition at bending residues and can be used
to identify hinge bending residues.
Probably only informative for interdomain rotations greater than 20 degrees
Residue
iResidue
i+1Distance of hinge axis to residue i in
(A) Distance of hinge axis to residue i in
(A) Change in
(deg) Change in
(deg) Angle of psi(i) axis to hinge axis
(deg) Angle of psi(i) axis to hinge axis
(deg) Percentage Progress
ILE-80
VAL-81
11.8
11.9
5.7
-8.7
141.5
142.5
52.4
VAL-81
VAL-82
9.0
8.9
-3.5
-4.7
102.0
104.8
54.7
VAL-82
ALA-83
6.2
6.0
10.9
-6.5
107.7
111.7
-26.1
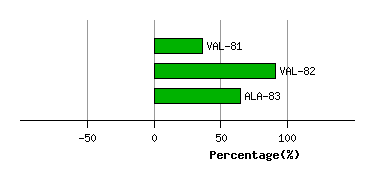
Graph shows rotational transition at bending residues and can be used
to identify hinge bending residues.
Probably only informative for interdomain rotations greater than 20 degrees
Residue
iResidue
i+1Distance of hinge axis to residue i in
(A) Distance of hinge axis to residue i in
(A) Change in
(deg) Change in
(deg) Angle of psi(i) axis to hinge axis
(deg) Angle of psi(i) axis to hinge axis
(deg) Percentage Progress
TYR-86
GLU-87
5.6
5.4
4.7
-0.6
77.2
75.0
98.2
GLU-87
PRO-88
3.3
3.5
1.4
1.0
60.6
57.3
-67.5
PRO-88
VAL-89
6.2
6.2
-0.2
-3.8
135.6
132.1
-80.2
VAL-89
LEU-90
6.8
6.8
1.0
0.1
42.7
39.8
36.4
LEU-90
ALA-91
5.4
5.4
-1.6
4.1
136.8
136.5
23.6
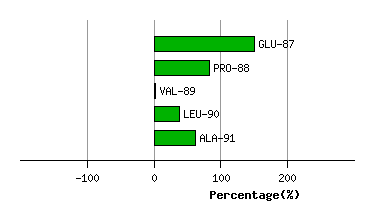
Graph shows rotational transition at bending residues and can be used
to identify hinge bending residues.
Probably only informative for interdomain rotations greater than 20 degrees
Residue
iResidue
i+1Distance of hinge axis to residue i in
(A) Distance of hinge axis to residue i in
(A) Change in
(deg) Change in
(deg) Angle of psi(i) axis to hinge axis
(deg) Angle of psi(i) axis to hinge axis
(deg) Percentage Progress
LEU-105
LYS-106
8.4
8.2
2.0
-2.0
66.2
66.7
9.8
LYS-106
ASP-107
10.6
10.5
7.2
3.5
117.6
120.1
-55.0
ASP-107
TYR-108
13.5
13.4
-4.1
-1.1
22.1
30.5
88.9
TYR-108
ALA-109
12.1
11.9
-8.3
11.2
91.3
97.0
5.1
ALA-109
ARG-110
12.4
12.0
-11.9
11.2
97.1
95.0
-86.6
ARG-110
LYS-111
15.8
15.4
3.6
-16.8
151.0
148.3
218.4
LYS-111
LEU-112
16.6
16.3
17.2
-8.0
120.2
123.8
-179.9
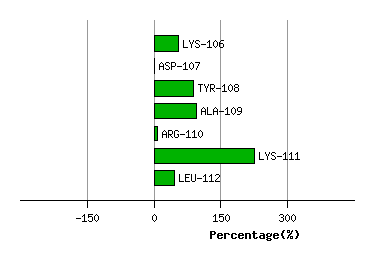
Graph shows rotational transition at bending residues and can be used
to identify hinge bending residues.
Probably only informative for interdomain rotations greater than 20 degrees
Residue
iResidue
i+1Distance of hinge axis to residue i in
(A) Distance of hinge axis to residue i in
(A) Change in
(deg) Change in
(deg) Angle of psi(i) axis to hinge axis
(deg) Angle of psi(i) axis to hinge axis
(deg) Percentage Progress
ALA-116
LYS-117
12.2
11.9
-1.2
7.7
169.1
170.7
106.0
LYS-117
GLY-118
11.4
11.4
-0.2
-3.6
97.1
97.3
-22.3
GLY-118
VAL-119
9.0
8.9
-4.1
6.2
59.2
58.8
10.8
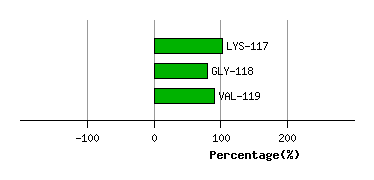
Graph shows rotational transition at bending residues and can be used
to identify hinge bending residues.
Probably only informative for interdomain rotations greater than 20 degrees
Residue
iResidue
i+1Distance of hinge axis to residue i in
(A) Distance of hinge axis to residue i in
(A) Change in
(deg) Change in
(deg) Angle of psi(i) axis to hinge axis
(deg) Angle of psi(i) axis to hinge axis
(deg) Percentage Progress
LEU-121
THR-122
4.7
4.4
-3.5
5.8
143.6
137.5
40.1
THR-122
GLU-123
5.0
4.8
-10.0
5.0
77.9
72.8
48.3
GLU-123
ARG-124
8.8
8.6
-4.3
-16.1
29.5
20.6
353.3
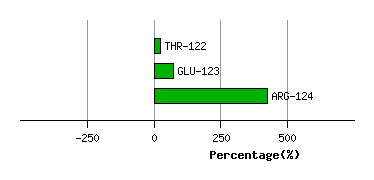
Graph shows rotational transition at bending residues and can be used
to identify hinge bending residues.
Probably only informative for interdomain rotations greater than 20 degrees
Residue
iResidue
i+1Distance of hinge axis to residue i in
(A) Distance of hinge axis to residue i in
(A) Change in
(deg) Change in
(deg) Angle of psi(i) axis to hinge axis
(deg) Angle of psi(i) axis to hinge axis
(deg) Percentage Progress
VAL-125
TRP-126
8.8
8.8
-7.6
9.4
143.0
145.4
102.0
TRP-126
GLN-127
7.7
7.7
0.9
7.6
47.7
44.3
149.0
GLN-127
PRO-128
7.4
7.4
9.8
-2.7
54.5
52.6
20.0
PRO-128
GLU-129
5.2
5.4
-9.5
-5.4
92.0
95.0
17.7
PRO-128
GLU-129
5.2
5.4
-9.5
-5.4
92.0
95.0
17.7
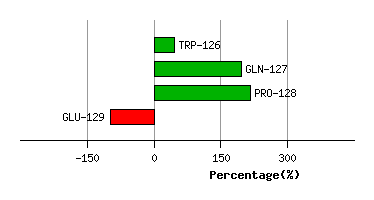
Graph shows rotational transition at bending residues and can be used
to identify hinge bending residues.
Probably only informative for interdomain rotations greater than 20 degrees
Residue
iResidue
i+1Distance of hinge axis to residue i in
(A) Distance of hinge axis to residue i in
(A) Change in
(deg) Change in
(deg) Angle of psi(i) axis to hinge axis
(deg) Angle of psi(i) axis to hinge axis
(deg) Percentage Progress
PRO-128
GLU-129
5.2
5.4
-9.5
-5.4
92.0
95.0
17.7
PRO-128
GLU-129
5.2
5.4
-9.5
-5.4
92.0
95.0
17.7
GLU-129
LEU-130
4.9
4.4
8.6
0.3
49.0
37.9
147.9
LEU-130
VAL-131
2.4
2.5
10.7
-8.5
113.6
108.3
-15.4
VAL-131
LYS-132
0.7
0.6
0.7
2.5
97.0
96.6
16.8
LYS-132
SER-133
4.1
3.8
3.2
-4.4
32.5
30.4
0.6
SER-133
LEU-134
5.3
4.9
-3.1
0.2
115.4
118.9
11.0
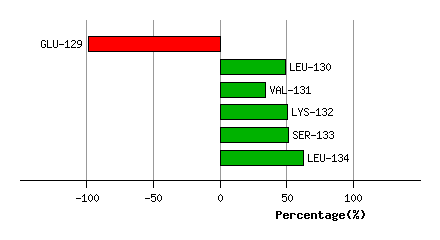
Graph shows rotational transition at bending residues and can be used
to identify hinge bending residues.
Probably only informative for interdomain rotations greater than 20 degrees
Residue
iResidue
i+1Distance of hinge axis to residue i in
(A) Distance of hinge axis to residue i in
(A) Change in
(deg) Change in
(deg) Angle of psi(i) axis to hinge axis
(deg) Angle of psi(i) axis to hinge axis
(deg) Percentage Progress
GLY-138
ILE-139
10.6
10.3
-0.8
-0.2
72.0
74.2
20.6
ILE-139
GLU-140
8.3
8.0
-2.3
0.6
140.1
140.0
-45.6
GLU-140
TYR-141
9.7
9.6
4.7
-2.2
90.4
91.7
90.8
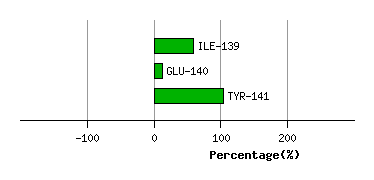
Graph shows rotational transition at bending residues and can be used
to identify hinge bending residues.
Probably only informative for interdomain rotations greater than 20 degrees
Residue
iResidue
i+1Distance of hinge axis to residue i in
(A) Distance of hinge axis to residue i in
(A) Change in
(deg) Change in
(deg) Angle of psi(i) axis to hinge axis
(deg) Angle of psi(i) axis to hinge axis
(deg) Percentage Progress
GLU-166
ASP-167
3.8
3.9
4.5
-0.6
92.6
95.8
-31.7
ASP-167
GLY-168
1.6
1.1
-6.2
-2.5
81.1
79.6
51.9
GLY-168
GLY-169
3.0
2.8
2.2
-6.7
121.4
110.6
55.8
GLY-169
GLU-170
2.2
3.2
17.1
1.9
57.9
43.1
178.5
GLU-170
VAL-171
4.0
4.4
-8.2
-9.2
115.6
104.4
-187.6
VAL-171
ILE-172
5.3
5.7
-12.4
5.7
156.4
158.5
-66.5
ILE-172
THR-173
6.6
6.8
4.3
-5.8
79.2
82.0
-52.5
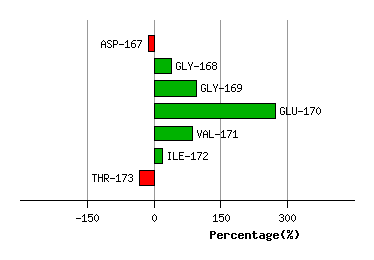
Graph shows rotational transition at bending residues and can be used
to identify hinge bending residues.
Probably only informative for interdomain rotations greater than 20 degrees
Residue
iResidue
i+1Distance of hinge axis to residue i in
(A) Distance of hinge axis to residue i in
(A) Change in
(deg) Change in
(deg) Angle of psi(i) axis to hinge axis
(deg) Angle of psi(i) axis to hinge axis
(deg) Percentage Progress
LEU-267
PRO-268
10.6
10.5
8.2
-12.9
88.5
88.6
22.2
PRO-268
ILE-269
12.4
12.1
9.7
6.9
32.9
25.3
287.3
ILE-269
ALA-270
12.1
12.1
13.8
1.8
46.7
54.4
121.4
ALA-270
SER-271
13.5
13.3
14.3
-22.0
38.5
29.6
-130.6
SER-271
TYR-272
12.7
12.7
-87.7
81.9
111.1
104.0
-44.1
TYR-272
PHE-273
15.8
14.7
-3.3
-1.0
94.8
89.5
-63.9
PHE-273
GLU-274
19.5
18.4
3.0
8.7
47.6
47.6
172.7
GLU-274
MET-275
19.6
19.1
11.6
-12.7
99.8
96.6
3.0
MET-275
SER-276
17.1
17.0
20.8
-1.2
131.0
131.3
-260.2
SER-276
GLU-277
19.3
19.5
6.7
-6.5
67.6
63.6
54.5
GLU-277
TRP-278
22.2
22.0
-2.0
-1.4
121.4
115.6
-7.9
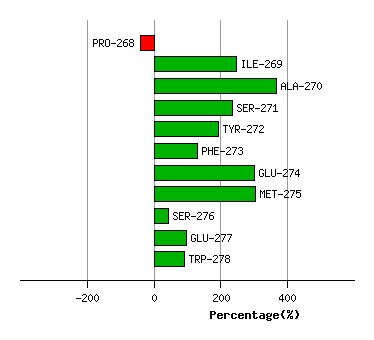
Graph shows rotational transition at bending residues and can be used
to identify hinge bending residues.
Probably only informative for interdomain rotations greater than 20 degrees
Residue
iResidue
i+1Distance of hinge axis to residue i in
(A) Distance of hinge axis to residue i in
(A) Change in
(deg) Change in
(deg) Angle of psi(i) axis to hinge axis
(deg) Angle of psi(i) axis to hinge axis
(deg) Percentage Progress
GLU-441
HIS-442
27.4
27.5
7.0
-4.2
82.2
75.6
1.3
HIS-442
TYR-443
28.7
28.5
4.3
-11.5
135.5
134.1
86.1
TYR-443
HIS-444
27.5
27.8
7.7
-11.0
147.1
144.6
40.5
HIS-444
GLU-445
29.7
30.0
153.4
-175.1
90.5
86.6
48.6
GLN-469
ILE-470
31.6
32.4
19.0
-14.7
124.0
127.3
-80.0
ILE-470
PRO-471
31.5
31.8
-3.8
-0.8
34.8
34.1
49.4
PRO-471
GLU-472
32.4
32.8
-25.3
41.7
93.4
84.9
-129.1
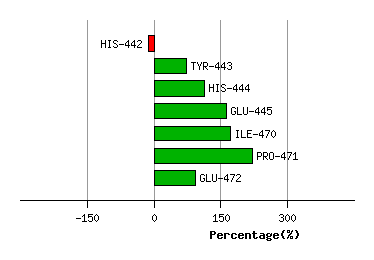
Graph shows rotational transition at bending residues and can be used
to identify hinge bending residues.
Probably only informative for interdomain rotations greater than 20 degrees
Residue
iResidue
i+1Distance of hinge axis to residue i in
(A) Distance of hinge axis to residue i in
(A) Change in
(deg) Change in
(deg) Angle of psi(i) axis to hinge axis
(deg) Angle of psi(i) axis to hinge axis
(deg) Percentage Progress
THR-623
LEU-624
25.8
25.9
8.3
-10.8
105.0
104.1
9.2
LEU-624
SER-625
25.7
25.9
-19.4
19.4
102.6
104.4
-24.8
SER-625
GLN-626
22.5
22.7
-4.0
-1.3
76.4
76.2
82.6
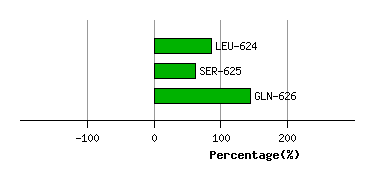
Graph shows rotational transition at bending residues and can be used
to identify hinge bending residues.
Probably only informative for interdomain rotations greater than 20 degrees
Residue
iResidue
i+1Distance of hinge axis to residue i in
(A) Distance of hinge axis to residue i in
(A) Change in
(deg) Change in
(deg) Angle of psi(i) axis to hinge axis
(deg) Angle of psi(i) axis to hinge axis
(deg) Percentage Progress
GLY-630
TRP-631
24.1
25.4
-13.4
-11.5
73.3
64.3
161.9
TRP-631
ASP-632
25.4
25.8
14.6
1.3
47.6
48.4
161.3
ASP-632
PHE-633
23.9
24.2
-7.9
5.0
60.9
63.3
39.2
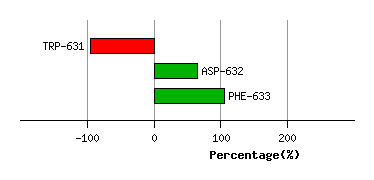
Graph shows rotational transition at bending residues and can be used
to identify hinge bending residues.
Probably only informative for interdomain rotations greater than 20 degrees