Phosphate-Binding Protein
(All numbering and residues are taken from first PDB file)
![]()
![]()
Bending Residue Dihedral Analysis
Residue
iResidue
i+1Distance of hinge axis to residue i in
(A) Distance of hinge axis to residue i in
(A) Change in
(deg) Change in
(deg) Angle of psi(i) axis to hinge axis
(deg) Angle of psi(i) axis to hinge axis
(deg) Percentage Progress
THR-74
VAL-75
8.4
8.4
2.3
-18.5
122.6
126.2
51.1
VAL-75
ILE-76
4.9
4.8
6.1
4.6
56.0
51.8
32.9
ILE-76
GLY-77
1.3
1.2
-3.4
-18.2
68.7
64.8
36.2
GLY-77
GLY-78
2.8
3.0
8.5
10.6
73.5
62.2
18.7
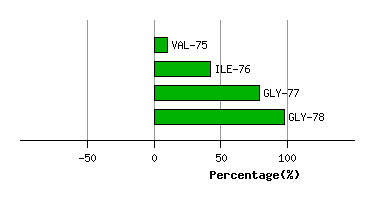
Graph shows rotational transition at bending residues and can be used
to identify hinge bending residues.
Probably only informative for interdomain rotations greater than 20 degrees
Residue
iResidue
i+1Distance of hinge axis to residue i in
(A) Distance of hinge axis to residue i in
(A) Change in
(deg) Change in
(deg) Angle of psi(i) axis to hinge axis
(deg) Angle of psi(i) axis to hinge axis
(deg) Percentage Progress
ASN-226
ALA-227
9.8
9.6
-6.1
-5.3
6.9
4.3
41.5
ALA-227
ALA-228
8.4
8.4
21.9
-32.2
113.4
117.8
8.3
ALA-228
LYS-229
7.6
7.3
32.8
-4.9
87.8
80.0
63.4
LYS-229
GLY-230
11.2
10.9
6.0
-25.4
148.6
140.5
85.1
GLY-230
ALA-231
12.0
12.4
30.6
6.2
151.9
134.3
-124.1
ALA-231
ASP-232
10.5
9.9
-8.6
-39.4
75.6
81.8
38.7
ASP-232
TRP-233
13.0
12.3
132.6
-132.0
69.7
92.4
-6.4
TRP-233
SER-234
12.0
11.5
25.1
-10.6
114.8
118.0
-47.4
SER-234
LYS-235
15.5
14.9
-130.1
-149.5
18.0
8.9
-267.0
LYS-235
THR-236
15.0
13.5
-124.0
30.6
69.3
83.4
114.7
THR-236
PHE-237
11.3
10.7
-125.6
-156.5
130.7
152.2
220.5
PHE-237
ALA-238
9.8
8.9
10.8
-9.8
101.0
108.1
-23.6
ALA-238
GLN-239
6.7
5.9
10.7
0.4
85.5
88.9
-26.0
GLN-239
ASP-240
5.3
4.7
-0.6
2.8
102.7
90.0
-7.5
ASP-240
LEU-241
3.2
3.2
-2.9
-18.8
131.8
134.1
-70.3
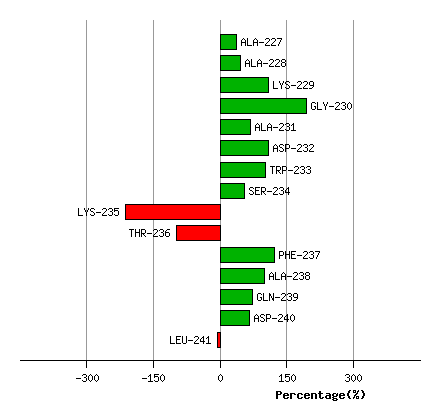
Graph shows rotational transition at bending residues and can be used
to identify hinge bending residues.
Probably only informative for interdomain rotations greater than 20 degrees
Residue
iResidue
i+1Distance of hinge axis to residue i in
(A) Distance of hinge axis to residue i in
(A) Change in
(deg) Change in
(deg) Angle of psi(i) axis to hinge axis
(deg) Angle of psi(i) axis to hinge axis
(deg) Percentage Progress
THR-253
SER-254
4.8
5.0
16.0
-28.3
126.2
126.7
22.3
SER-254
THR-255
1.7
1.7
-4.8
37.0
123.5
124.6
70.9
THR-255
THR-256
2.3
2.3
13.6
-21.6
113.5
106.1
11.4
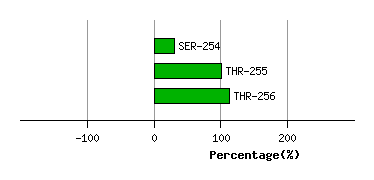
Graph shows rotational transition at bending residues and can be used
to identify hinge bending residues.
Probably only informative for interdomain rotations greater than 20 degrees