Aromatic Amino Acid Aminotransferase
(All numbering and residues are taken from first PDB file)
![]()
![]()
Bending Residue Dihedral Analysis
Residue
iResidue
i+1Distance of hinge axis to residue i in
(A) Distance of hinge axis to residue i in
(A) Change in
(deg) Change in
(deg) Angle of psi(i) axis to hinge axis
(deg) Angle of psi(i) axis to hinge axis
(deg) Percentage Progress
ILE-33
ASP-34
12.5
12.4
-40.3
40.6
44.6
51.5
35.6
ASP-34
LEU-35
11.1
11.5
-1.9
-13.1
98.9
91.7
-13.6
LEU-35
GLY-36
7.5
8.0
23.2
-11.9
134.5
140.2
-70.7
GLY-36
VAL-37
8.8
9.4
-83.4
7.8
108.2
98.7
-84.5
VAL-37
GLY-38
10.8
11.7
-0.9
20.4
86.0
132.5
78.7
GLY-38
VAL-39
11.2
11.0
79.3
-22.0
37.8
37.6
381.0
VAL-39
TYR-40
12.4
12.4
-23.6
-6.1
140.3
137.4
-190.8
TYR-40
LYS-41
10.8
10.7
2.0
4.5
55.7
55.2
24.3
LYS-41
ASP-42
10.6
10.3
11.1
-0.6
40.5
36.3
35.5
ASP-42
ALA-43
9.3
9.2
-13.2
4.6
99.8
91.5
-17.7
ALA-43
THR-44
8.2
7.7
9.7
-18.3
95.1
97.0
13.9
THR-44
GLY-45
12.0
11.5
30.1
-26.8
156.4
149.8
-11.6
GLY-45
HIS-46
12.4
12.0
15.8
-17.9
99.3
92.3
-5.7
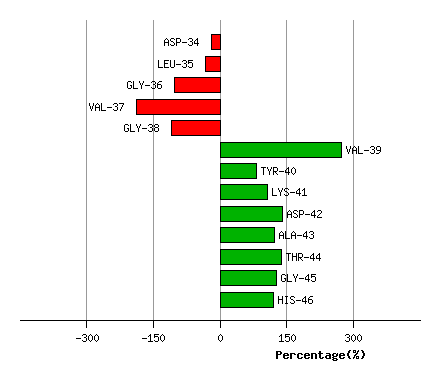
Graph shows rotational transition at bending residues and can be used
to identify hinge bending residues.
Probably only informative for interdomain rotations greater than 20 degrees
Residue
iResidue
i+1Distance of hinge axis to residue i in
(A) Distance of hinge axis to residue i in
(A) Change in
(deg) Change in
(deg) Angle of psi(i) axis to hinge axis
(deg) Angle of psi(i) axis to hinge axis
(deg) Percentage Progress
ARG-332
LEU-333
4.8
4.4
8.2
-10.9
56.7
59.6
-13.6
LEU-333
ARG-334
2.2
1.9
4.2
-1.0
39.5
39.9
27.9
ARG-334
GLU-335
4.6
4.3
8.9
-1.9
105.6
103.6
0.5
GLU-335
GLN-336
7.7
7.3
-13.0
12.4
79.9
86.2
12.6
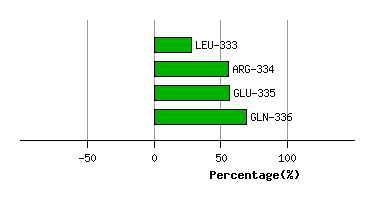
Graph shows rotational transition at bending residues and can be used
to identify hinge bending residues.
Probably only informative for interdomain rotations greater than 20 degrees
Residue
iResidue
i+1Distance of hinge axis to residue i in
(A) Distance of hinge axis to residue i in
(A) Change in
(deg) Change in
(deg) Angle of psi(i) axis to hinge axis
(deg) Angle of psi(i) axis to hinge axis
(deg) Percentage Progress
ALA-338
GLY-339
9.3
8.7
11.7
-5.9
60.7
61.8
18.9
GLY-339
GLU-340
11.5
11.0
-1.7
3.7
78.8
77.2
-4.9
GLU-340
LEU-341
11.6
11.3
-9.1
8.7
26.5
27.3
-3.1
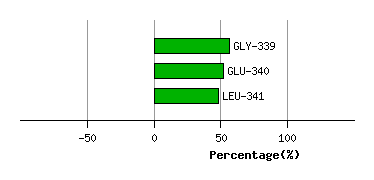
Graph shows rotational transition at bending residues and can be used
to identify hinge bending residues.
Probably only informative for interdomain rotations greater than 20 degrees
Residue
iResidue
i+1Distance of hinge axis to residue i in
(A) Distance of hinge axis to residue i in
(A) Change in
(deg) Change in
(deg) Angle of psi(i) axis to hinge axis
(deg) Angle of psi(i) axis to hinge axis
(deg) Percentage Progress
ASP-348
ARG-349
16.4
16.8
147.8
53.7
32.3
79.0
-606.5
ARG-349
PHE-350
14.8
14.1
10.7
27.6
97.3
111.1
-4.4
PHE-350
GLY-351
11.3
10.9
-2.5
-14.8
47.6
46.1
89.7
GLY-351
PHE-352
12.2
11.5
4.8
2.3
77.2
76.7
19.1
PHE-352
VAL-353
10.4
9.9
-0.7
4.4
59.6
58.0
-35.6
VAL-353
ALA-354
7.1
6.8
-18.2
16.6
35.4
39.6
10.3
ALA-354
GLU-355
9.2
8.8
5.0
-7.2
75.9
76.2
-12.4
GLU-355
HIS-356
11.4
11.1
0.6
-4.8
70.4
68.6
-11.0
HIS-356
ARG-357
9.0
8.8
-11.4
7.4
44.3
42.4
28.6
ARG-357
GLY-358
9.7
9.8
-13.3
31.9
107.3
108.6
39.2
GLY-358
MET-359
8.9
8.9
30.6
-24.5
102.5
110.6
23.5
MET-359
PHE-360
6.5
6.9
-15.9
3.3
140.2
132.0
-97.7
PHE-360
SER-361
5.0
4.9
9.6
-5.1
73.4
79.8
6.3
SER-361
ARG-362
3.1
3.1
-7.0
11.5
140.3
140.1
67.2
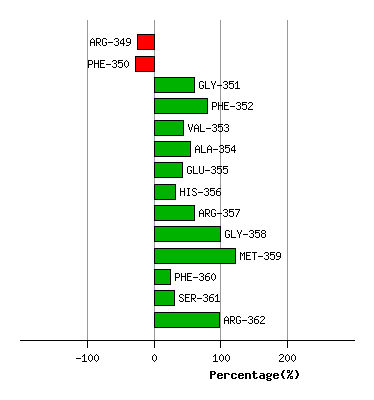
Graph shows rotational transition at bending residues and can be used
to identify hinge bending residues.
Probably only informative for interdomain rotations greater than 20 degrees
Residue
iResidue
i+1Distance of hinge axis to residue i in
(A) Distance of hinge axis to residue i in
(A) Change in
(deg) Change in
(deg) Angle of psi(i) axis to hinge axis
(deg) Angle of psi(i) axis to hinge axis
(deg) Percentage Progress
VAL-382
GLY-383
7.1
7.3
-22.3
27.4
47.1
45.6
-55.9
GLY-383
ASP-384
6.6
6.8
-13.7
2.5
80.4
80.6
12.2
ASP-384
SER-385
2.9
3.1
14.6
-1.7
39.5
37.2
93.1
SER-385
ARG-386
3.0
3.0
-11.7
7.5
135.1
137.5
-72.0
ARG-386
ILE-387
2.6
2.8
-2.6
-1.4
144.9
145.3
-18.4
ILE-387
ASN-388
3.1
3.2
-22.2
21.5
128.9
131.4
24.5
ASN-388
ILE-389
4.6
4.9
-14.2
-2.9
146.4
147.7
-148.0
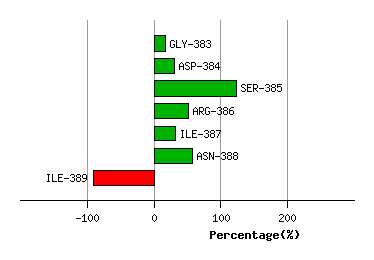
Graph shows rotational transition at bending residues and can be used
to identify hinge bending residues.
Probably only informative for interdomain rotations greater than 20 degrees
Residue
iResidue
i+1Distance of hinge axis to residue i in
(A) Distance of hinge axis to residue i in
(A) Change in
(deg) Change in
(deg) Angle of psi(i) axis to hinge axis
(deg) Angle of psi(i) axis to hinge axis
(deg) Percentage Progress
GLY-391
LEU-392
6.5
7.0
78.0
-77.5
66.0
85.8
17.3
LEU-392
ASN-393
4.7
5.4
-10.7
19.2
179.8
163.4
66.5
ASN-393
ASP-394
5.4
5.4
-5.1
-9.7
101.7
96.9
-31.9
ASP-394
ASN-395
7.3
6.7
21.8
-5.8
113.3
94.5
-24.3
ASN-395
THR-396
10.4
10.0
14.2
-27.6
176.5
165.3
115.7
THR-396
ILE-397
9.4
9.7
15.8
-7.1
115.4
123.0
-68.2
ILE-397
PRO-398
7.8
7.7
0.7
-2.9
105.7
106.5
-5.4
PRO-398
ILE-399
11.5
11.3
7.7
-0.9
148.8
138.9
-30.8
ILE-399
LEU-400
12.6
12.6
7.3
-6.2
146.2
151.5
-40.9
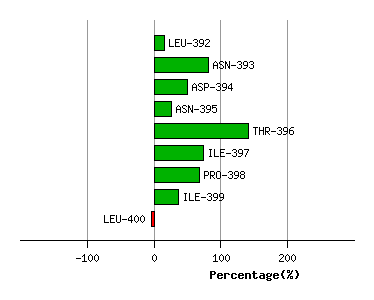
Graph shows rotational transition at bending residues and can be used
to identify hinge bending residues.
Probably only informative for interdomain rotations greater than 20 degrees