Beta-1,3-1,4-Glucanase
(All numbering and residues are taken from first PDB file)
![]()
![]()
Bending Residue Dihedral Analysis
Residue
iResidue
i+1Distance of hinge axis to residue i in
(A) Distance of hinge axis to residue i in
(A) Change in
(deg) Change in
(deg) Angle of psi(i) axis to hinge axis
(deg) Angle of psi(i) axis to hinge axis
(deg) Percentage Progress
HIS-131
THR-132
4.4
4.3
0.8
-1.9
164.1
163.5
43.0
THR-132
SER-133
4.7
4.6
1.3
-2.8
115.5
116.9
-26.9
SER-133
ASP-134
7.4
7.2
0.4
0.5
71.7
73.7
4.2
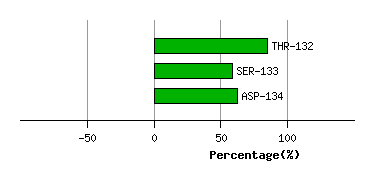
Graph shows rotational transition at bending residues and can be used
to identify hinge bending residues.
Probably only informative for interdomain rotations greater than 20 degrees
Residue
iResidue
i+1Distance of hinge axis to residue i in
(A) Distance of hinge axis to residue i in
(A) Change in
(deg) Change in
(deg) Angle of psi(i) axis to hinge axis
(deg) Angle of psi(i) axis to hinge axis
(deg) Percentage Progress
THR-137
ILE-138
9.9
10.2
-13.5
9.8
73.2
69.8
39.6
ILE-138
ASP-139
9.6
9.8
4.2
-8.8
129.6
128.2
30.3
ASP-139
ASN-140
12.4
12.6
-1.6
8.9
25.0
24.5
-179.3
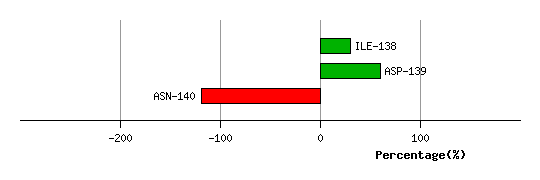
Graph shows rotational transition at bending residues and can be used
to identify hinge bending residues.
Probably only informative for interdomain rotations greater than 20 degrees
Residue
iResidue
i+1Distance of hinge axis to residue i in
(A) Distance of hinge axis to residue i in
(A) Change in
(deg) Change in
(deg) Angle of psi(i) axis to hinge axis
(deg) Angle of psi(i) axis to hinge axis
(deg) Percentage Progress
LEU-147
LYS-148
6.8
6.9
0.2
6.2
76.4
78.1
9.2
LYS-148
THR-149
7.0
7.1
-9.4
2.8
42.0
41.4
69.1
THR-149
SER-150
8.3
8.4
-5.4
0.5
46.5
48.6
167.3
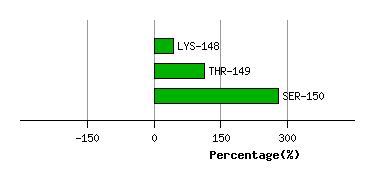
Graph shows rotational transition at bending residues and can be used
to identify hinge bending residues.
Probably only informative for interdomain rotations greater than 20 degrees
Residue
iResidue
i+1Distance of hinge axis to residue i in
(A) Distance of hinge axis to residue i in
(A) Change in
(deg) Change in
(deg) Angle of psi(i) axis to hinge axis
(deg) Angle of psi(i) axis to hinge axis
(deg) Percentage Progress
GLN-159
ASP-160
13.7
13.7
-3.8
-7.1
95.5
100.1
-27.6
ASP-160
ALA-161
14.1
14.1
-1.9
15.5
154.8
149.7
232.6
ALA-161
ASN-162
14.3
14.3
-10.4
-4.0
88.4
89.8
-126.6
ASN-162
ALA-163
11.0
10.9
6.2
-0.2
39.6
35.9
116.4
ASN-162
ALA-163
11.0
10.9
6.2
-0.2
39.6
35.9
116.4
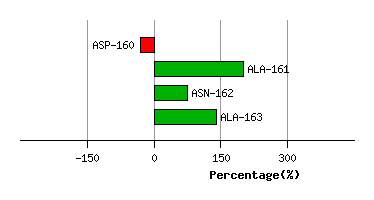
Graph shows rotational transition at bending residues and can be used
to identify hinge bending residues.
Probably only informative for interdomain rotations greater than 20 degrees
Residue
iResidue
i+1Distance of hinge axis to residue i in
(A) Distance of hinge axis to residue i in
(A) Change in
(deg) Change in
(deg) Angle of psi(i) axis to hinge axis
(deg) Angle of psi(i) axis to hinge axis
(deg) Percentage Progress
ASN-162
ALA-163
11.0
10.9
6.2
-0.2
39.6
35.9
116.4
ASN-162
ALA-163
11.0
10.9
6.2
-0.2
39.6
35.9
116.4
ALA-163
GLY-164
9.0
9.1
-2.6
5.1
66.4
68.8
-26.0
GLY-164
CYS-165
6.6
6.6
-8.5
9.5
126.3
126.7
28.3
CYS-165
GLY-166
5.2
5.3
-5.2
1.5
127.4
125.7
-110.5
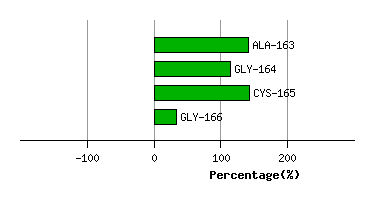
Graph shows rotational transition at bending residues and can be used
to identify hinge bending residues.
Probably only informative for interdomain rotations greater than 20 degrees
Residue
iResidue
i+1Distance of hinge axis to residue i in
(A) Distance of hinge axis to residue i in
(A) Change in
(deg) Change in
(deg) Angle of psi(i) axis to hinge axis
(deg) Angle of psi(i) axis to hinge axis
(deg) Percentage Progress
GLY-231
CYS-232
12.9
13.0
-2.3
0.3
63.9
60.2
12.6
CYS-232
ASP-233
9.7
9.9
13.2
-18.5
136.3
138.0
154.0
ASP-233
TRP-234
8.9
8.9
-12.7
9.6
104.7
102.1
-106.5
TRP-234
GLU-235
7.2
7.0
-3.9
8.6
48.1
43.5
-91.7
GLU-235
GLY-236
7.0
7.1
-1.6
-3.1
62.6
60.7
32.5
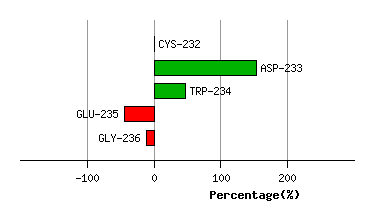
Graph shows rotational transition at bending residues and can be used
to identify hinge bending residues.
Probably only informative for interdomain rotations greater than 20 degrees