Beta-1,3-1,4-Glucanase
(All numbering and residues are taken from first PDB file)
![]()
![]()
Bending Residue Dihedral Analysis
Residue
iResidue
i+1Distance of hinge axis to residue i in
(A) Distance of hinge axis to residue i in
(A) Change in
(deg) Change in
(deg) Angle of psi(i) axis to hinge axis
(deg) Angle of psi(i) axis to hinge axis
(deg) Percentage Progress
PRO-109
TYR-110
9.1
8.9
1.0
2.6
118.1
117.9
14.9
TYR-110
GLY-111
6.9
6.9
-0.7
0.4
96.7
96.4
86.0
GLY-111
GLY-112
4.2
4.2
-5.1
2.6
164.7
162.1
-61.7
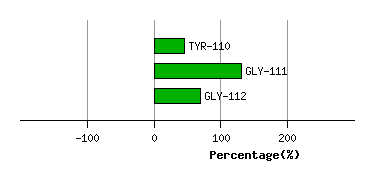
Graph shows rotational transition at bending residues and can be used
to identify hinge bending residues.
Probably only informative for interdomain rotations greater than 20 degrees
Residue
iResidue
i+1Distance of hinge axis to residue i in
(A) Distance of hinge axis to residue i in
(A) Change in
(deg) Change in
(deg) Angle of psi(i) axis to hinge axis
(deg) Angle of psi(i) axis to hinge axis
(deg) Percentage Progress
GLU-113
ILE-114
5.5
5.4
-2.6
2.1
29.0
29.8
38.1
ILE-114
ASP-115
4.2
4.1
-0.5
0.2
48.0
47.7
-51.0
ASP-115
ILE-116
6.3
6.2
-4.7
3.9
41.6
42.8
60.2
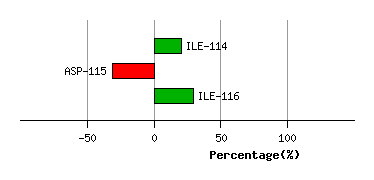
Graph shows rotational transition at bending residues and can be used
to identify hinge bending residues.
Probably only informative for interdomain rotations greater than 20 degrees
Residue
iResidue
i+1Distance of hinge axis to residue i in
(A) Distance of hinge axis to residue i in
(A) Change in
(deg) Change in
(deg) Angle of psi(i) axis to hinge axis
(deg) Angle of psi(i) axis to hinge axis
(deg) Percentage Progress
VAL-129
LEU-130
5.1
5.2
3.4
-5.1
165.4
165.4
-52.4
LEU-130
HIS-131
4.8
4.8
-3.1
-0.8
65.6
63.8
-28.5
HIS-131
THR-132
7.6
7.5
-2.2
0.7
23.1
23.7
59.0
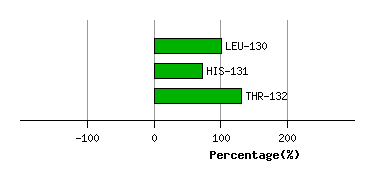
Graph shows rotational transition at bending residues and can be used
to identify hinge bending residues.
Probably only informative for interdomain rotations greater than 20 degrees
Residue
iResidue
i+1Distance of hinge axis to residue i in
(A) Distance of hinge axis to residue i in
(A) Change in
(deg) Change in
(deg) Angle of psi(i) axis to hinge axis
(deg) Angle of psi(i) axis to hinge axis
(deg) Percentage Progress
CYS-136
THR-137
10.6
10.5
0.7
-1.2
166.5
165.4
-27.6
THR-137
ILE-138
11.7
11.8
-6.3
1.6
65.0
63.6
78.2
ILE-138
ASP-139
10.5
10.6
2.6
-1.9
134.4
135.1
-49.8
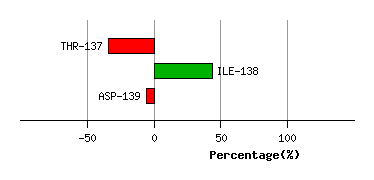
Graph shows rotational transition at bending residues and can be used
to identify hinge bending residues.
Probably only informative for interdomain rotations greater than 20 degrees
Residue
iResidue
i+1Distance of hinge axis to residue i in
(A) Distance of hinge axis to residue i in
(A) Change in
(deg) Change in
(deg) Angle of psi(i) axis to hinge axis
(deg) Angle of psi(i) axis to hinge axis
(deg) Percentage Progress
ASN-146
LEU-147
6.8
6.9
2.8
-7.0
149.1
152.2
102.9
LEU-147
LYS-148
8.7
8.7
5.3
2.5
84.5
84.1
-20.1
LYS-148
THR-149
10.7
10.7
-5.4
3.3
37.2
37.9
7.7
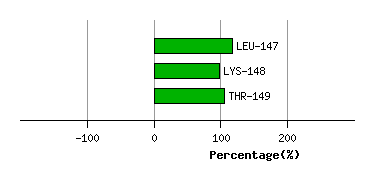
Graph shows rotational transition at bending residues and can be used
to identify hinge bending residues.
Probably only informative for interdomain rotations greater than 20 degrees
Residue
iResidue
i+1Distance of hinge axis to residue i in
(A) Distance of hinge axis to residue i in
(A) Change in
(deg) Change in
(deg) Angle of psi(i) axis to hinge axis
(deg) Angle of psi(i) axis to hinge axis
(deg) Percentage Progress
GLY-166
ILE-167
7.2
7.1
-1.8
1.0
34.4
34.7
18.6
ILE-167
GLU-168
5.2
5.2
0.0
-4.6
129.0
127.9
84.8
GLU-168
ALA-169
5.0
5.0
-0.8
2.4
57.7
52.7
-17.0
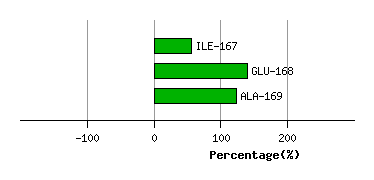
Graph shows rotational transition at bending residues and can be used
to identify hinge bending residues.
Probably only informative for interdomain rotations greater than 20 degrees
Residue
iResidue
i+1Distance of hinge axis to residue i in
(A) Distance of hinge axis to residue i in
(A) Change in
(deg) Change in
(deg) Angle of psi(i) axis to hinge axis
(deg) Angle of psi(i) axis to hinge axis
(deg) Percentage Progress
ALA-224
ALA-225
3.6
3.7
9.5
-15.0
125.8
125.7
56.9
ALA-225
LYS-226
3.1
3.3
-3.7
1.5
43.8
37.6
83.5
LYS-226
PHE-227
5.8
5.8
4.3
1.8
124.7
124.8
-58.4
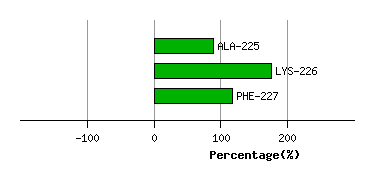
Graph shows rotational transition at bending residues and can be used
to identify hinge bending residues.
Probably only informative for interdomain rotations greater than 20 degrees
Residue
iResidue
i+1Distance of hinge axis to residue i in
(A) Distance of hinge axis to residue i in
(A) Change in
(deg) Change in
(deg) Angle of psi(i) axis to hinge axis
(deg) Angle of psi(i) axis to hinge axis
(deg) Percentage Progress
ASP-233
TRP-234
9.7
9.5
-12.1
7.7
75.8
79.1
169.6
TRP-234
GLU-235
7.0
6.8
-2.7
5.1
131.8
136.0
56.5
GLU-235
GLY-236
6.4
6.6
3.2
-8.3
54.1
52.0
-90.1
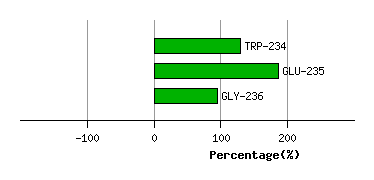
Graph shows rotational transition at bending residues and can be used
to identify hinge bending residues.
Probably only informative for interdomain rotations greater than 20 degrees