Ryanodine Receptor 1 Chimera
(All numbering and residues are taken from first PDB file)
![]()
![]()
Bending Residue Dihedral Analysis
Residue
iResidue
i+1Distance of hinge axis to residue i in
(A) Distance of hinge axis to residue i in
(A) Change in
(deg) Change in
(deg) Angle of psi(i) axis to hinge axis
(deg) Angle of psi(i) axis to hinge axis
(deg) Percentage Progress
LEU-27
SER-28
6.4
7.8
62.3
-2.5
76.2
90.0
18.8
SER-28
GLU-29
4.1
5.6
14.0
15.1
96.5
105.2
-25.9
GLU-29
ARG-30
7.6
9.2
-17.7
4.0
18.1
11.5
31.2
ARG-30
ILE-31
8.0
8.8
6.4
-18.7
113.9
107.7
35.7
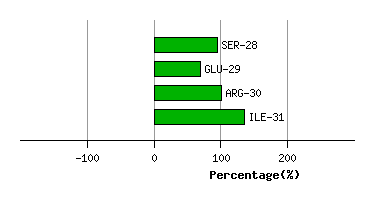
Graph shows rotational transition at bending residues and can be used
to identify hinge bending residues.
Probably only informative for interdomain rotations greater than 20 degrees
Residue
iResidue
i+1Distance of hinge axis to residue i in
(A) Distance of hinge axis to residue i in
(A) Change in
(deg) Change in
(deg) Angle of psi(i) axis to hinge axis
(deg) Angle of psi(i) axis to hinge axis
(deg) Percentage Progress
LYS-75
GLU-76
13.2
12.9
-17.8
2.4
63.5
58.3
114.0
GLU-76
TYR-77
11.0
10.5
0.6
-7.8
65.3
80.9
-10.9
TYR-77
ASP-78
10.8
10.4
8.0
5.8
43.8
23.1
30.1
ASP-78
ARG-79
9.0
9.8
8.7
-7.5
107.4
88.0
15.2
ARG-79
ASN-80
6.9
6.8
2.0
-10.3
120.4
112.2
17.8
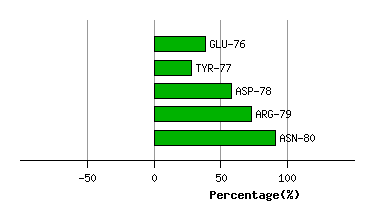
Graph shows rotational transition at bending residues and can be used
to identify hinge bending residues.
Probably only informative for interdomain rotations greater than 20 degrees
Residue
iResidue
i+1Distance of hinge axis to residue i in
(A) Distance of hinge axis to residue i in
(A) Change in
(deg) Change in
(deg) Angle of psi(i) axis to hinge axis
(deg) Angle of psi(i) axis to hinge axis
(deg) Percentage Progress
ILE-96
GLU-97
10.0
9.9
19.1
-7.9
92.4
74.6
34.6
GLU-97
LYS-98
12.4
11.9
0.8
14.8
148.9
128.0
-33.3
LYS-98
GLU-99
13.0
12.1
6.4
47.4
108.7
136.0
478.5
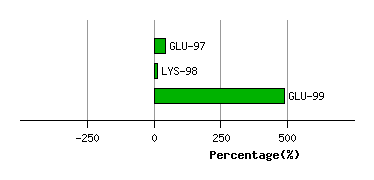
Graph shows rotational transition at bending residues and can be used
to identify hinge bending residues.
Probably only informative for interdomain rotations greater than 20 degrees
Residue
iResidue
i+1Distance of hinge axis to residue i in
(A) Distance of hinge axis to residue i in
(A) Change in
(deg) Change in
(deg) Angle of psi(i) axis to hinge axis
(deg) Angle of psi(i) axis to hinge axis
(deg) Percentage Progress
ASP-128
LEU-129
5.9
5.6
-48.4
22.6
85.1
64.3
40.6
LEU-129
SER-130
2.9
2.7
-4.4
-14.4
139.6
120.6
-48.2
SER-130
LEU-131
4.0
2.6
1.1
43.2
69.8
71.5
66.7
LEU-131
VAL-132
1.1
1.2
-31.0
21.0
49.6
46.2
2.4
VAL-132
ASP-133
2.4
2.9
12.4
-1.7
91.6
86.5
-2.2
ASP-133
LEU-134
6.2
6.4
-11.8
3.3
31.0
22.4
34.4
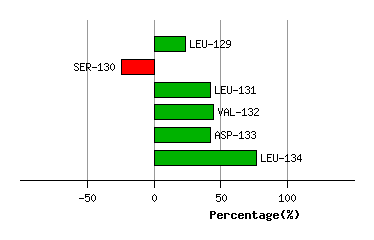
Graph shows rotational transition at bending residues and can be used
to identify hinge bending residues.
Probably only informative for interdomain rotations greater than 20 degrees