Beta-1,3-1,4-Glucanase
(All numbering and residues are taken from first PDB file)
![]()
![]()
Bending Residue Dihedral Analysis
Residue
iResidue
i+1Distance of hinge axis to residue i in
(A) Distance of hinge axis to residue i in
(A) Change in
(deg) Change in
(deg) Angle of psi(i) axis to hinge axis
(deg) Angle of psi(i) axis to hinge axis
(deg) Percentage Progress
THR-102
LEU-103
5.2
5.2
1.3
-4.4
84.3
83.9
-71.8
LEU-103
GLY-104
7.7
7.7
1.8
-1.6
47.2
44.1
31.4
GLY-104
THR-105
8.2
8.3
7.3
-6.0
32.7
36.2
19.2
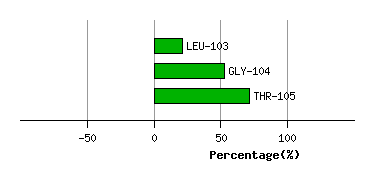
Graph shows rotational transition at bending residues and can be used
to identify hinge bending residues.
Probably only informative for interdomain rotations greater than 20 degrees
Residue
iResidue
i+1Distance of hinge axis to residue i in
(A) Distance of hinge axis to residue i in
(A) Change in
(deg) Change in
(deg) Angle of psi(i) axis to hinge axis
(deg) Angle of psi(i) axis to hinge axis
(deg) Percentage Progress
GLY-111
GLY-112
11.4
11.5
4.3
-1.0
37.9
39.0
63.5
GLY-112
GLU-113
10.2
10.2
-6.0
4.8
89.5
90.6
2.3
GLU-113
ILE-114
8.3
8.4
-0.9
1.3
141.9
141.1
1.5
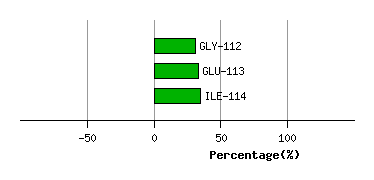
Graph shows rotational transition at bending residues and can be used
to identify hinge bending residues.
Probably only informative for interdomain rotations greater than 20 degrees
Residue
iResidue
i+1Distance of hinge axis to residue i in
(A) Distance of hinge axis to residue i in
(A) Change in
(deg) Change in
(deg) Angle of psi(i) axis to hinge axis
(deg) Angle of psi(i) axis to hinge axis
(deg) Percentage Progress
THR-124
PHE-125
13.8
14.0
-6.3
10.6
110.9
111.6
99.4
PHE-125
ASN-126
10.2
10.3
-8.3
4.0
153.5
152.4
-109.8
ASN-126
HIS-127
8.6
8.8
6.7
3.9
97.9
94.6
41.2
HIS-127
MET-128
7.4
7.4
19.2
-24.5
30.2
34.7
-45.4
MET-128
VAL-129
4.8
4.7
-8.4
3.9
92.0
91.9
67.2
VAL-129
LEU-130
6.9
6.8
4.3
-3.3
28.8
29.5
19.6
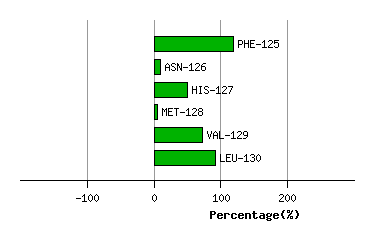
Graph shows rotational transition at bending residues and can be used
to identify hinge bending residues.
Probably only informative for interdomain rotations greater than 20 degrees
Residue
iResidue
i+1Distance of hinge axis to residue i in
(A) Distance of hinge axis to residue i in
(A) Change in
(deg) Change in
(deg) Angle of psi(i) axis to hinge axis
(deg) Angle of psi(i) axis to hinge axis
(deg) Percentage Progress
ILE-138
ASP-139
11.7
11.6
-0.3
-3.7
156.3
157.5
-100.5
ASP-139
ASN-140
12.0
11.8
0.6
-7.6
59.7
60.2
-126.3
ASN-140
ASP-141
9.5
9.4
34.9
-26.0
73.4
69.8
74.6
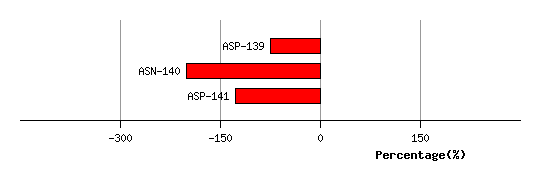
Graph shows rotational transition at bending residues and can be used
to identify hinge bending residues.
Probably only informative for interdomain rotations greater than 20 degrees
Residue
iResidue
i+1Distance of hinge axis to residue i in
(A) Distance of hinge axis to residue i in
(A) Change in
(deg) Change in
(deg) Angle of psi(i) axis to hinge axis
(deg) Angle of psi(i) axis to hinge axis
(deg) Percentage Progress
LEU-147
LYS-148
5.9
5.9
0.2
-2.8
107.1
108.4
23.7
LYS-148
THR-149
8.9
8.9
2.4
-0.2
71.9
71.9
5.3
THR-149
SER-150
11.3
11.3
1.1
2.8
61.4
60.6
182.0
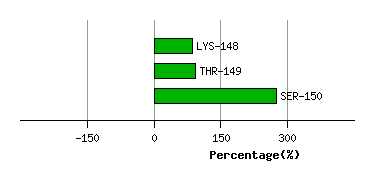
Graph shows rotational transition at bending residues and can be used
to identify hinge bending residues.
Probably only informative for interdomain rotations greater than 20 degrees
Residue
iResidue
i+1Distance of hinge axis to residue i in
(A) Distance of hinge axis to residue i in
(A) Change in
(deg) Change in
(deg) Angle of psi(i) axis to hinge axis
(deg) Angle of psi(i) axis to hinge axis
(deg) Percentage Progress
CYS-165
GLY-166
10.2
10.2
-5.1
3.6
94.9
95.6
-4.3
GLY-166
ILE-167
7.7
7.8
1.3
0.4
38.7
38.4
59.7
ILE-167
GLU-168
4.6
4.6
-3.4
-1.0
95.5
95.0
8.9
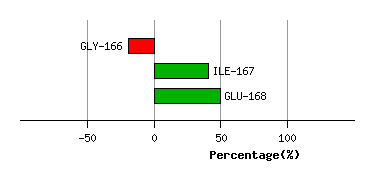
Graph shows rotational transition at bending residues and can be used
to identify hinge bending residues.
Probably only informative for interdomain rotations greater than 20 degrees
Residue
iResidue
i+1Distance of hinge axis to residue i in
(A) Distance of hinge axis to residue i in
(A) Change in
(deg) Change in
(deg) Angle of psi(i) axis to hinge axis
(deg) Angle of psi(i) axis to hinge axis
(deg) Percentage Progress
ILE-191
THR-192
6.2
6.1
1.2
-0.1
70.7
69.3
46.5
THR-192
PRO-193
10.0
9.9
3.8
-11.9
91.3
91.0
77.4
PRO-193
ASN-194
12.8
12.6
12.1
4.2
157.4
156.3
-416.7
ASN-194
GLY-195
13.2
13.2
-21.7
10.4
53.0
53.6
226.3
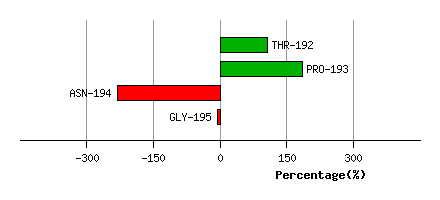
Graph shows rotational transition at bending residues and can be used
to identify hinge bending residues.
Probably only informative for interdomain rotations greater than 20 degrees
Residue
iResidue
i+1Distance of hinge axis to residue i in
(A) Distance of hinge axis to residue i in
(A) Change in
(deg) Change in
(deg) Angle of psi(i) axis to hinge axis
(deg) Angle of psi(i) axis to hinge axis
(deg) Percentage Progress
ALA-224
ALA-225
3.6
3.6
2.4
-3.2
85.1
87.3
3.9
ALA-225
LYS-226
1.9
1.8
-3.5
6.3
123.7
124.6
38.8
LYS-226
PHE-227
5.3
5.3
1.8
-2.1
87.4
85.1
9.2
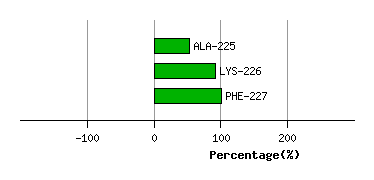
Graph shows rotational transition at bending residues and can be used
to identify hinge bending residues.
Probably only informative for interdomain rotations greater than 20 degrees
Residue
iResidue
i+1Distance of hinge axis to residue i in
(A) Distance of hinge axis to residue i in
(A) Change in
(deg) Change in
(deg) Angle of psi(i) axis to hinge axis
(deg) Angle of psi(i) axis to hinge axis
(deg) Percentage Progress
ASP-233
TRP-234
16.5
16.4
1.1
1.6
111.5
112.2
-60.5
TRP-234
GLU-235
12.9
12.8
3.2
-5.0
170.4
169.7
66.5
GLU-235
GLY-236
13.5
13.4
-4.0
1.7
60.1
60.2
45.2
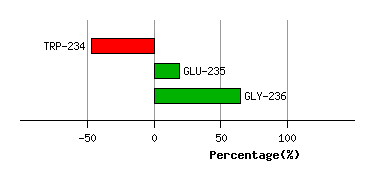
Graph shows rotational transition at bending residues and can be used
to identify hinge bending residues.
Probably only informative for interdomain rotations greater than 20 degrees
Residue
iResidue
i+1Distance of hinge axis to residue i in
(A) Distance of hinge axis to residue i in
(A) Change in
(deg) Change in
(deg) Angle of psi(i) axis to hinge axis
(deg) Angle of psi(i) axis to hinge axis
(deg) Percentage Progress
LYS-237
PHE-238
13.2
13.3
0.3
0.9
65.1
66.4
34.2
PHE-238
ASN-239
9.9
9.9
2.0
-3.7
23.2
22.7
-10.2
ASN-239
ALA-240
9.0
9.0
-0.1
4.3
101.2
102.8
0.3
ALA-240
GLN-241
5.7
5.8
-4.5
2.1
65.5
62.9
38.9
GLN-241
ARG-242
3.9
3.9
-6.7
2.1
116.4
115.0
-46.4
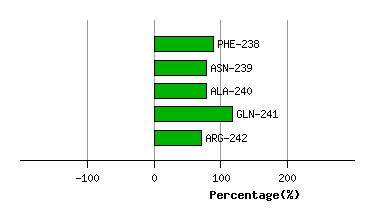
Graph shows rotational transition at bending residues and can be used
to identify hinge bending residues.
Probably only informative for interdomain rotations greater than 20 degrees