Aristolochene Synthase
(All numbering and residues are taken from first PDB file)
![]()
![]()
Bending Residue Dihedral Analysis
Residue
iResidue
i+1Distance of hinge axis to residue i in
(A) Distance of hinge axis to residue i in
(A) Change in
(deg) Change in
(deg) Angle of psi(i) axis to hinge axis
(deg) Angle of psi(i) axis to hinge axis
(deg) Percentage Progress
GLN-22
PRO-23
4.1
4.0
19.2
5.5
63.5
72.6
91.1
PRO-23
LEU-24
0.8
1.3
-11.4
-16.4
72.9
78.8
55.2
LEU-24
CYS-25
3.0
2.7
-16.9
15.2
93.0
104.9
-22.4
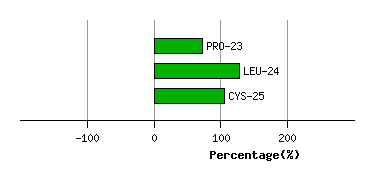
Graph shows rotational transition at bending residues and can be used
to identify hinge bending residues.
Probably only informative for interdomain rotations greater than 20 degrees
Residue
iResidue
i+1Distance of hinge axis to residue i in
(A) Distance of hinge axis to residue i in
(A) Change in
(deg) Change in
(deg) Angle of psi(i) axis to hinge axis
(deg) Angle of psi(i) axis to hinge axis
(deg) Percentage Progress
ASP-159
ARG-160
26.0
25.9
-4.8
-47.4
102.0
116.0
-58.4
ARG-160
THR-161
29.1
28.8
123.8
-33.0
68.7
108.4
41.3
THR-161
ARG-162
27.3
27.4
173.6
-30.2
10.6
81.6
937.0
ARG-162
ALA-163
27.7
29.9
163.1
26.9
71.1
44.4
-711.6
ALA-163
ARG-164
31.2
31.1
148.2
-82.1
111.7
121.0
-228.8
ARG-164
PRO-165
31.4
31.5
12.2
-8.0
55.1
60.8
68.1
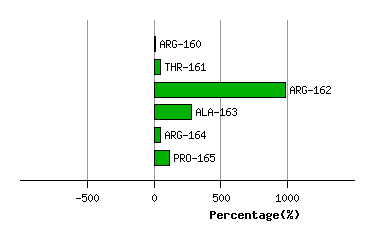
Graph shows rotational transition at bending residues and can be used
to identify hinge bending residues.
Probably only informative for interdomain rotations greater than 20 degrees
Residue
iResidue
i+1Distance of hinge axis to residue i in
(A) Distance of hinge axis to residue i in
(A) Change in
(deg) Change in
(deg) Angle of psi(i) axis to hinge axis
(deg) Angle of psi(i) axis to hinge axis
(deg) Percentage Progress
GLY-169
GLY-170
23.5
24.0
9.2
5.5
60.5
57.6
69.3
GLY-170
TYR-171
23.8
24.2
-15.4
9.0
57.4
58.7
34.7
TYR-171
LEU-172
22.8
22.8
5.7
-13.9
92.9
91.4
13.8
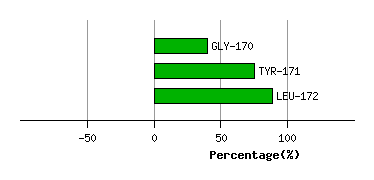
Graph shows rotational transition at bending residues and can be used
to identify hinge bending residues.
Probably only informative for interdomain rotations greater than 20 degrees
Residue
iResidue
i+1Distance of hinge axis to residue i in
(A) Distance of hinge axis to residue i in
(A) Change in
(deg) Change in
(deg) Angle of psi(i) axis to hinge axis
(deg) Angle of psi(i) axis to hinge axis
(deg) Percentage Progress
LEU-194
LYS-195
8.3
8.2
-9.5
11.6
25.2
23.5
0.2
LYS-195
LEU-196
8.0
8.3
-29.1
23.4
70.6
69.4
26.9
LEU-196
SER-197
5.1
5.1
-16.8
12.4
12.4
16.8
36.8
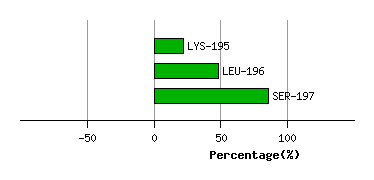
Graph shows rotational transition at bending residues and can be used
to identify hinge bending residues.
Probably only informative for interdomain rotations greater than 20 degrees
Residue
iResidue
i+1Distance of hinge axis to residue i in
(A) Distance of hinge axis to residue i in
(A) Change in
(deg) Change in
(deg) Angle of psi(i) axis to hinge axis
(deg) Angle of psi(i) axis to hinge axis
(deg) Percentage Progress
GLN-310
THR-311
12.0
12.5
5.0
-9.8
133.1
126.0
19.4
THR-311
THR-312
12.1
12.8
18.0
-8.2
80.5
69.0
14.2
THR-312
LEU-313
14.7
15.2
-5.9
5.4
66.5
67.4
2.8
LEU-313
ARG-314
18.0
18.6
-8.8
-0.4
136.8
133.3
-32.7
ARG-314
TYR-315
19.5
20.0
9.3
-6.4
88.9
90.9
17.4
TYR-315
SER-316
19.1
19.9
12.0
59.8
152.9
153.1
-605.2
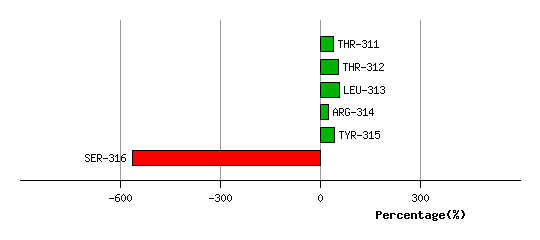
Graph shows rotational transition at bending residues and can be used
to identify hinge bending residues.
Probably only informative for interdomain rotations greater than 20 degrees