Beta-Agarase B
(All numbering and residues are taken from first PDB file)
![]()
![]()
Bending Residue Dihedral Analysis
Residue
iResidue
i+1Distance of hinge axis to residue i in
(A) Distance of hinge axis to residue i in
(A) Change in
(deg) Change in
(deg) Angle of psi(i) axis to hinge axis
(deg) Angle of psi(i) axis to hinge axis
(deg) Percentage Progress
SER-213
HIS-214
3.3
3.3
-2.8
-0.3
6.4
5.0
73.4
HIS-214
HIS-215
2.8
2.8
-9.4
14.0
83.4
84.1
102.8
HIS-215
VAL-216
4.9
4.9
-1.9
-1.3
20.5
21.9
28.6
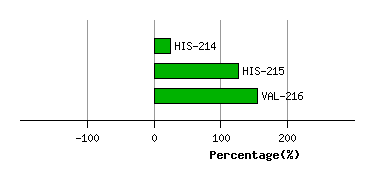
Graph shows rotational transition at bending residues and can be used
to identify hinge bending residues.
Probably only informative for interdomain rotations greater than 20 degrees
Residue
iResidue
i+1Distance of hinge axis to residue i in
(A) Distance of hinge axis to residue i in
(A) Change in
(deg) Change in
(deg) Angle of psi(i) axis to hinge axis
(deg) Angle of psi(i) axis to hinge axis
(deg) Percentage Progress
LYS-228
ASP-229
5.0
4.9
-12.1
4.0
35.3
35.4
335.4
ASP-229
ALA-230
4.3
4.1
1.2
2.4
121.8
118.5
69.1
ALA-230
GLY-231
1.9
1.7
-6.8
7.7
107.6
108.5
2.8
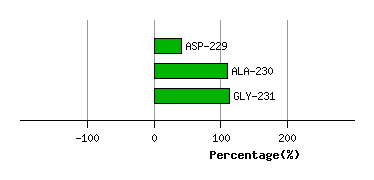
Graph shows rotational transition at bending residues and can be used
to identify hinge bending residues.
Probably only informative for interdomain rotations greater than 20 degrees
Residue
iResidue
i+1Distance of hinge axis to residue i in
(A) Distance of hinge axis to residue i in
(A) Change in
(deg) Change in
(deg) Angle of psi(i) axis to hinge axis
(deg) Angle of psi(i) axis to hinge axis
(deg) Percentage Progress
VAL-269
SER-270
6.5
6.5
-8.6
9.3
29.3
30.4
23.7
SER-270
GLY-271
8.9
9.1
1.4
-2.6
99.3
98.7
9.2
GLY-271
LYS-272
10.1
10.2
0.4
-2.8
99.9
99.3
135.4
LYS-272
ASP-273
9.8
9.8
6.1
-4.3
42.4
43.4
-11.8
ASP-273
ILE-274
10.8
10.8
3.1
-2.5
57.9
58.0
-57.1
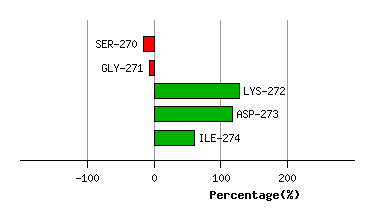
Graph shows rotational transition at bending residues and can be used
to identify hinge bending residues.
Probably only informative for interdomain rotations greater than 20 degrees
Residue
iResidue
i+1Distance of hinge axis to residue i in
(A) Distance of hinge axis to residue i in
(A) Change in
(deg) Change in
(deg) Angle of psi(i) axis to hinge axis
(deg) Angle of psi(i) axis to hinge axis
(deg) Percentage Progress
THR-293
ARG-294
11.6
11.6
-4.8
2.4
61.9
61.8
59.0
ARG-294
THR-295
9.0
9.0
4.7
-10.0
67.9
66.7
-180.6
THR-295
GLY-296
5.6
5.6
3.5
-9.1
137.2
138.9
162.9
GLY-296
LEU-297
4.4
4.3
8.5
-3.6
83.3
80.3
59.7
LEU-297
ASN-298
1.4
1.4
2.0
3.0
37.8
38.6
-1.9
ASN-298
LYS-299
2.3
2.4
-5.5
1.3
118.3
117.0
-118.8
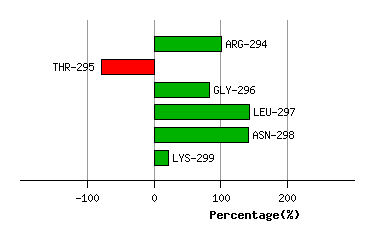
Graph shows rotational transition at bending residues and can be used
to identify hinge bending residues.
Probably only informative for interdomain rotations greater than 20 degrees