Aspartate Aminotransferase (E.C.2.6.1.1)
(All numbering and residues are taken from first PDB file)
![]()
![]()
Bending Residue Dihedral Analysis
Residue
iResidue
i+1Distance of hinge axis to residue i in
(A) Distance of hinge axis to residue i in
(A) Change in
(deg) Change in
(deg) Angle of psi(i) axis to hinge axis
(deg) Angle of psi(i) axis to hinge axis
(deg) Percentage Progress
ILE-33
ASN-34
13.8
14.2
-5.4
4.0
53.9
56.5
31.3
ASN-34
LEU-35
12.3
12.1
4.0
-22.6
107.3
111.9
50.4
LEU-35
GLY-36
9.2
9.3
7.9
5.5
121.4
128.8
-84.5
GLY-36
ILE-37
10.2
10.3
-82.6
-3.0
120.6
101.2
-490.9
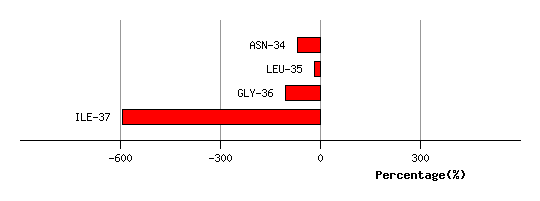
Graph shows rotational transition at bending residues and can be used
to identify hinge bending residues.
Probably only informative for interdomain rotations greater than 20 degrees
Residue
iResidue
i+1Distance of hinge axis to residue i in
(A) Distance of hinge axis to residue i in
(A) Change in
(deg) Change in
(deg) Angle of psi(i) axis to hinge axis
(deg) Angle of psi(i) axis to hinge axis
(deg) Percentage Progress
GLY-38
VAL-39
8.0
7.4
105.8
-22.7
35.8
22.4
953.5
VAL-39
TYR-40
7.4
7.0
-19.7
4.0
108.2
110.3
-3.1
TYR-40
LYS-41
4.0
3.8
-4.4
-1.1
137.7
137.0
-21.4
LYS-41
ASP-42
3.7
3.6
-4.0
-0.9
110.4
112.2
-37.5
ASP-42
GLU-43
2.1
2.4
-7.4
6.3
91.9
91.2
76.5
GLU-43
THR-44
5.6
5.9
11.9
-28.2
65.1
69.2
-38.4
THR-44
GLY-45
6.7
7.2
14.5
-8.0
125.0
120.1
-12.2

Graph shows rotational transition at bending residues and can be used
to identify hinge bending residues.
Probably only informative for interdomain rotations greater than 20 degrees
Residue
iResidue
i+1Distance of hinge axis to residue i in
(A) Distance of hinge axis to residue i in
(A) Change in
(deg) Change in
(deg) Angle of psi(i) axis to hinge axis
(deg) Angle of psi(i) axis to hinge axis
(deg) Percentage Progress
ARG-332
MET-333
9.6
9.5
-15.2
13.4
113.2
114.1
79.3
MET-333
ARG-334
7.8
7.9
0.3
4.6
7.7
7.2
72.0
ARG-334
GLN-335
7.8
7.7
-9.8
-3.6
96.0
105.3
-33.0
GLN-335
LEU-336
11.6
11.5
16.2
-2.7
104.7
109.0
-67.0
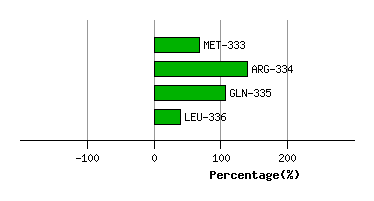
Graph shows rotational transition at bending residues and can be used
to identify hinge bending residues.
Probably only informative for interdomain rotations greater than 20 degrees
Residue
iResidue
i+1Distance of hinge axis to residue i in
(A) Distance of hinge axis to residue i in
(A) Change in
(deg) Change in
(deg) Angle of psi(i) axis to hinge axis
(deg) Angle of psi(i) axis to hinge axis
(deg) Percentage Progress
SER-351
PHE-352
12.2
12.4
-19.3
6.7
78.6
84.7
-35.4
PHE-352
ILE-353
9.2
9.3
-4.5
8.0
144.0
140.8
51.9
ILE-353
ILE-354
7.4
7.4
-4.8
8.7
124.1
130.1
24.9
ILE-354
LYS-355
9.9
9.4
-11.5
16.5
66.7
72.1
-46.2
LYS-355
GLN-356
9.6
9.1
-4.4
9.6
98.4
96.3
24.7
GLN-356
ASN-357
6.2
5.7
-14.0
15.0
157.8
152.8
-2.5
ASN-357
GLY-358
6.4
6.3
17.2
-5.0
65.7
66.6
110.5
GLY-358
MET-359
4.6
4.7
-3.4
10.0
99.2
110.8
-104.5
MET-359
PHE-360
1.4
1.8
-8.6
1.9
39.9
51.1
92.4
PHE-360
SER-361
1.4
1.2
-2.7
45.0
39.0
44.4
-578.3
SER-361
PHE-362
1.4
2.6
-25.3
-10.9
63.2
44.9
298.3
PHE-362
SER-363
3.8
3.3
-21.5
5.7
94.0
80.0
2.7
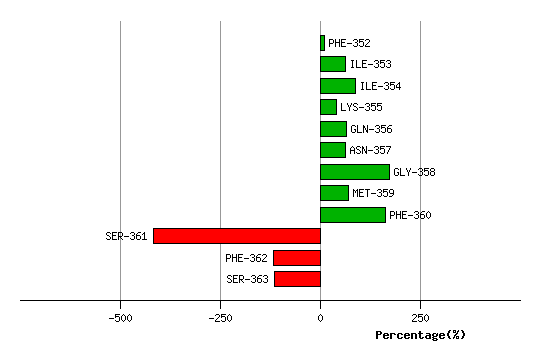
Graph shows rotational transition at bending residues and can be used
to identify hinge bending residues.
Probably only informative for interdomain rotations greater than 20 degrees
Residue
iResidue
i+1Distance of hinge axis to residue i in
(A) Distance of hinge axis to residue i in
(A) Change in
(deg) Change in
(deg) Angle of psi(i) axis to hinge axis
(deg) Angle of psi(i) axis to hinge axis
(deg) Percentage Progress
GLY-385
ARG-386
8.9
8.9
14.7
-16.6
50.1
50.6
37.7
ARG-386
VAL-387
6.3
6.4
-5.3
4.0
154.5
152.9
-67.1
VAL-387
ASN-388
6.1
6.5
-2.6
14.9
128.6
132.6
220.5
ASN-388
VAL-389
4.4
4.9
-7.4
-6.3
122.4
119.4
-129.3
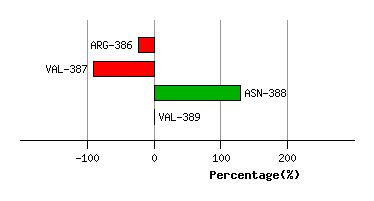
Graph shows rotational transition at bending residues and can be used
to identify hinge bending residues.
Probably only informative for interdomain rotations greater than 20 degrees