RNA Uridylyl Transferase
(All numbering and residues are taken from first PDB file)
![]()
![]()
Bending Residue Dihedral Analysis
Residue
iResidue
i+1Distance of hinge axis to residue i in
(A) Distance of hinge axis to residue i in
(A) Change in
(deg) Change in
(deg) Angle of psi(i) axis to hinge axis
(deg) Angle of psi(i) axis to hinge axis
(deg) Percentage Progress
HIS-28
VAL-29
12.7
12.7
86.8
-31.7
28.6
34.2
217.2
VAL-29
ASP-30
9.9
10.3
19.7
9.5
54.7
41.0
130.6
ASP-30
ALA-31
11.0
11.7
12.3
-16.0
65.2
61.0
-24.8
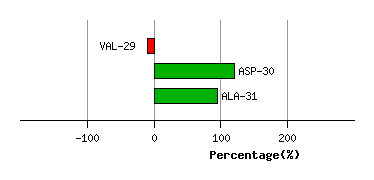
Graph shows rotational transition at bending residues and can be used
to identify hinge bending residues.
Probably only informative for interdomain rotations greater than 20 degrees
Residue
iResidue
i+1Distance of hinge axis to residue i in
(A) Distance of hinge axis to residue i in
(A) Change in
(deg) Change in
(deg) Angle of psi(i) axis to hinge axis
(deg) Angle of psi(i) axis to hinge axis
(deg) Percentage Progress
ARG-48
LEU-49
8.5
7.3
13.4
-13.9
61.4
57.4
-32.9
LEU-49
TYR-50
7.0
6.4
-24.1
19.7
144.0
138.1
-47.0
TYR-50
THR-51
4.3
3.6
0.2
-3.5
55.3
50.6
10.5
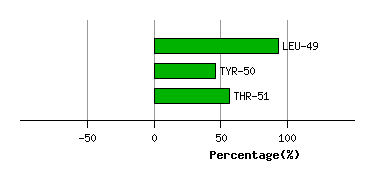
Graph shows rotational transition at bending residues and can be used
to identify hinge bending residues.
Probably only informative for interdomain rotations greater than 20 degrees
Residue
iResidue
i+1Distance of hinge axis to residue i in
(A) Distance of hinge axis to residue i in
(A) Change in
(deg) Change in
(deg) Angle of psi(i) axis to hinge axis
(deg) Angle of psi(i) axis to hinge axis
(deg) Percentage Progress
VAL-57
TYR-58
3.5
3.9
2.5
5.6
164.0
165.3
-38.2
TYR-58
GLY-59
2.2
2.7
-2.2
2.7
75.7
77.8
30.4
GLY-59
VAL-60
1.9
1.4
1.1
-13.1
127.6
121.2
41.8
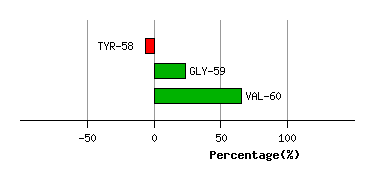
Graph shows rotational transition at bending residues and can be used
to identify hinge bending residues.
Probably only informative for interdomain rotations greater than 20 degrees
Residue
iResidue
i+1Distance of hinge axis to residue i in
(A) Distance of hinge axis to residue i in
(A) Change in
(deg) Change in
(deg) Angle of psi(i) axis to hinge axis
(deg) Angle of psi(i) axis to hinge axis
(deg) Percentage Progress
ALA-90
LYS-91
7.0
8.3
-1.2
-11.9
123.3
123.0
-36.5
LYS-91
GLY-92
9.8
10.8
-17.9
2.7
61.7
63.3
34.8
GLY-92
LEU-93
9.8
10.9
21.1
-0.6
75.8
84.4
37.4
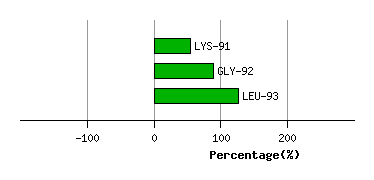
Graph shows rotational transition at bending residues and can be used
to identify hinge bending residues.
Probably only informative for interdomain rotations greater than 20 degrees
Residue
iResidue
i+1Distance of hinge axis to residue i in
(A) Distance of hinge axis to residue i in
(A) Change in
(deg) Change in
(deg) Angle of psi(i) axis to hinge axis
(deg) Angle of psi(i) axis to hinge axis
(deg) Percentage Progress
GLN-94
ALA-95
7.7
8.0
7.9
-14.9
90.4
94.9
-27.9
ALA-95
ASP-96
11.4
11.7
8.2
46.4
76.0
63.0
85.4
ASP-96
ILE-97
11.4
11.0
-101.2
65.8
78.7
59.3
43.7
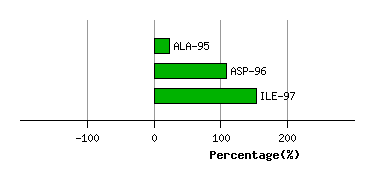
Graph shows rotational transition at bending residues and can be used
to identify hinge bending residues.
Probably only informative for interdomain rotations greater than 20 degrees
Residue
iResidue
i+1Distance of hinge axis to residue i in
(A) Distance of hinge axis to residue i in
(A) Change in
(deg) Change in
(deg) Angle of psi(i) axis to hinge axis
(deg) Angle of psi(i) axis to hinge axis
(deg) Percentage Progress
THR-138
ALA-139
7.6
7.7
1.6
-7.5
124.8
123.0
39.0
ALA-139
TYR-140
5.2
5.1
-0.8
11.2
68.7
65.8
-13.4
TYR-140
ARG-141
1.9
2.4
-1.7
-9.3
115.2
112.4
-1.2
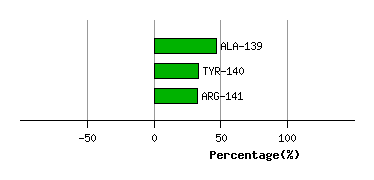
Graph shows rotational transition at bending residues and can be used
to identify hinge bending residues.
Probably only informative for interdomain rotations greater than 20 degrees