Nad-Dependent Malic Enzyme, Mitochondrial
(All numbering and residues are taken from first PDB file)
![]()
![]()
Bending Residue Dihedral Analysis
Residue
iResidue
i+1Distance of hinge axis to residue i in
(A) Distance of hinge axis to residue i in
(A) Change in
(deg) Change in
(deg) Angle of psi(i) axis to hinge axis
(deg) Angle of psi(i) axis to hinge axis
(deg) Percentage Progress
VAL-2286
ALA-2287
6.2
6.0
-1.0
8.6
79.3
84.2
-48.2
ALA-2287
LEU-2288
8.4
8.3
-19.9
11.9
95.5
104.9
26.7
LEU-2288
ALA-2289
6.5
6.9
0.0
14.6
16.5
12.7
126.9
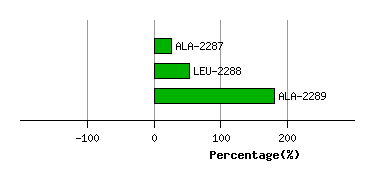
Graph shows rotational transition at bending residues and can be used
to identify hinge bending residues.
Probably only informative for interdomain rotations greater than 20 degrees
Residue
iResidue
i+1Distance of hinge axis to residue i in
(A) Distance of hinge axis to residue i in
(A) Change in
(deg) Change in
(deg) Angle of psi(i) axis to hinge axis
(deg) Angle of psi(i) axis to hinge axis
(deg) Percentage Progress
LEU-2291
LEU-2292
10.8
10.6
23.2
-42.7
120.0
110.8
141.2
LEU-2292
ALA-2293
9.5
9.9
4.1
6.5
156.7
161.2
-94.4
ALA-2293
ALA-2294
10.3
10.1
13.1
-13.4
85.2
91.5
-9.0
ALA-2294
GLN-2295
13.7
13.7
-30.6
24.0
94.8
94.5
-25.8
GLN-2295
LYS-2296
14.6
15.1
-23.9
25.7
29.5
33.3
-41.9
LYS-2296
VAL-2297
14.3
13.9
4.9
-17.9
113.8
130.9
60.6
VAL-2297
ILE-2298
17.0
16.5
15.9
-2.3
53.3
57.8
44.6
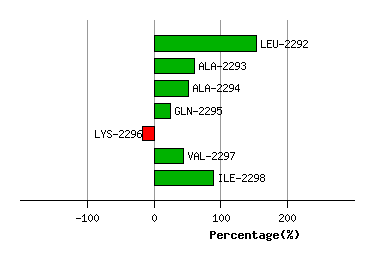
Graph shows rotational transition at bending residues and can be used
to identify hinge bending residues.
Probably only informative for interdomain rotations greater than 20 degrees
Residue
iResidue
i+1Distance of hinge axis to residue i in
(A) Distance of hinge axis to residue i in
(A) Change in
(deg) Change in
(deg) Angle of psi(i) axis to hinge axis
(deg) Angle of psi(i) axis to hinge axis
(deg) Percentage Progress
PRO-2462
GLY-2463
16.8
17.0
-7.9
8.2
95.6
97.2
1.8
GLY-2463
GLN-2464
13.5
13.8
4.6
-14.1
37.0
36.7
-17.7
GLN-2464
GLY-2465
13.6
13.8
44.6
-31.2
48.1
67.1
126.5
GLY-2465
ASN-2466
11.7
11.1
-22.6
68.6
122.3
107.9
158.7
ASN-2466
ASN-2467
11.9
11.8
-7.6
-3.4
93.8
111.0
-107.0
ASN-2467
VAL-2468
9.9
10.0
-9.0
3.7
48.7
50.4
-1.4
VAL-2468
TYR-2469
11.5
11.0
10.5
-0.4
124.3
116.9
-58.3
TYR-2469
ILE-2470
8.1
7.4
-22.1
23.2
116.2
119.8
27.7
ILE-2470
PHE-2471
6.8
6.5
-34.8
29.6
104.8
99.5
-15.8
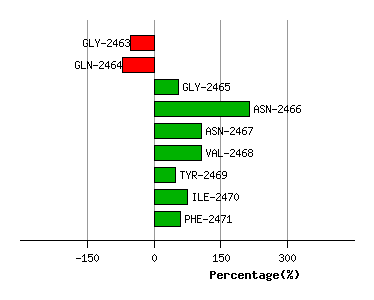
Graph shows rotational transition at bending residues and can be used
to identify hinge bending residues.
Probably only informative for interdomain rotations greater than 20 degrees
Residue
iResidue
i+1Distance of hinge axis to residue i in
(A) Distance of hinge axis to residue i in
(A) Change in
(deg) Change in
(deg) Angle of psi(i) axis to hinge axis
(deg) Angle of psi(i) axis to hinge axis
(deg) Percentage Progress
THR-2499
SER-2500
4.3
4.4
-28.7
4.8
134.4
143.4
-153.0
SER-2500
GLN-2501
4.7
5.0
29.8
-6.2
23.9
33.7
223.1
GLN-2501
LEU-2502
2.5
2.5
-13.7
19.5
113.8
124.6
9.3
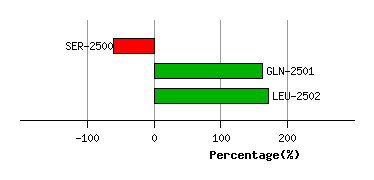
Graph shows rotational transition at bending residues and can be used
to identify hinge bending residues.
Probably only informative for interdomain rotations greater than 20 degrees
Residue
iResidue
i+1Distance of hinge axis to residue i in
(A) Distance of hinge axis to residue i in
(A) Change in
(deg) Change in
(deg) Angle of psi(i) axis to hinge axis
(deg) Angle of psi(i) axis to hinge axis
(deg) Percentage Progress
LEU-2512
TYR-2513
11.1
10.6
6.2
11.8
88.1
86.4
-8.9
TYR-2513
PRO-2514
8.3
8.6
-16.3
-12.5
18.4
18.4
275.1
PRO-2514
PRO-2515
6.6
6.9
-13.6
12.1
78.2
75.6
-14.8
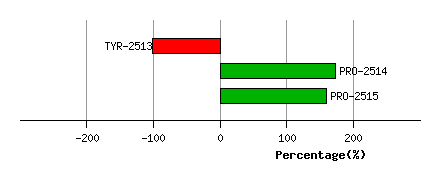
Graph shows rotational transition at bending residues and can be used
to identify hinge bending residues.
Probably only informative for interdomain rotations greater than 20 degrees